Day 06
Describing Distributions


EPSY 5261 : Introductory Statistical Methods

Learning Goals

At the end of this lesson, you should be able to …

  • Name and describe the three key features of a distribution.
  • Identify and explain when to use the mean or median to describe the center of a distribution.
  • Identify and explain when to use the standard deviation or IQR to describe the variability of a distribution.
  • Describe distributions key features in the context of the data.

RECALL: Graphs for Quantitative Variables

Histogram

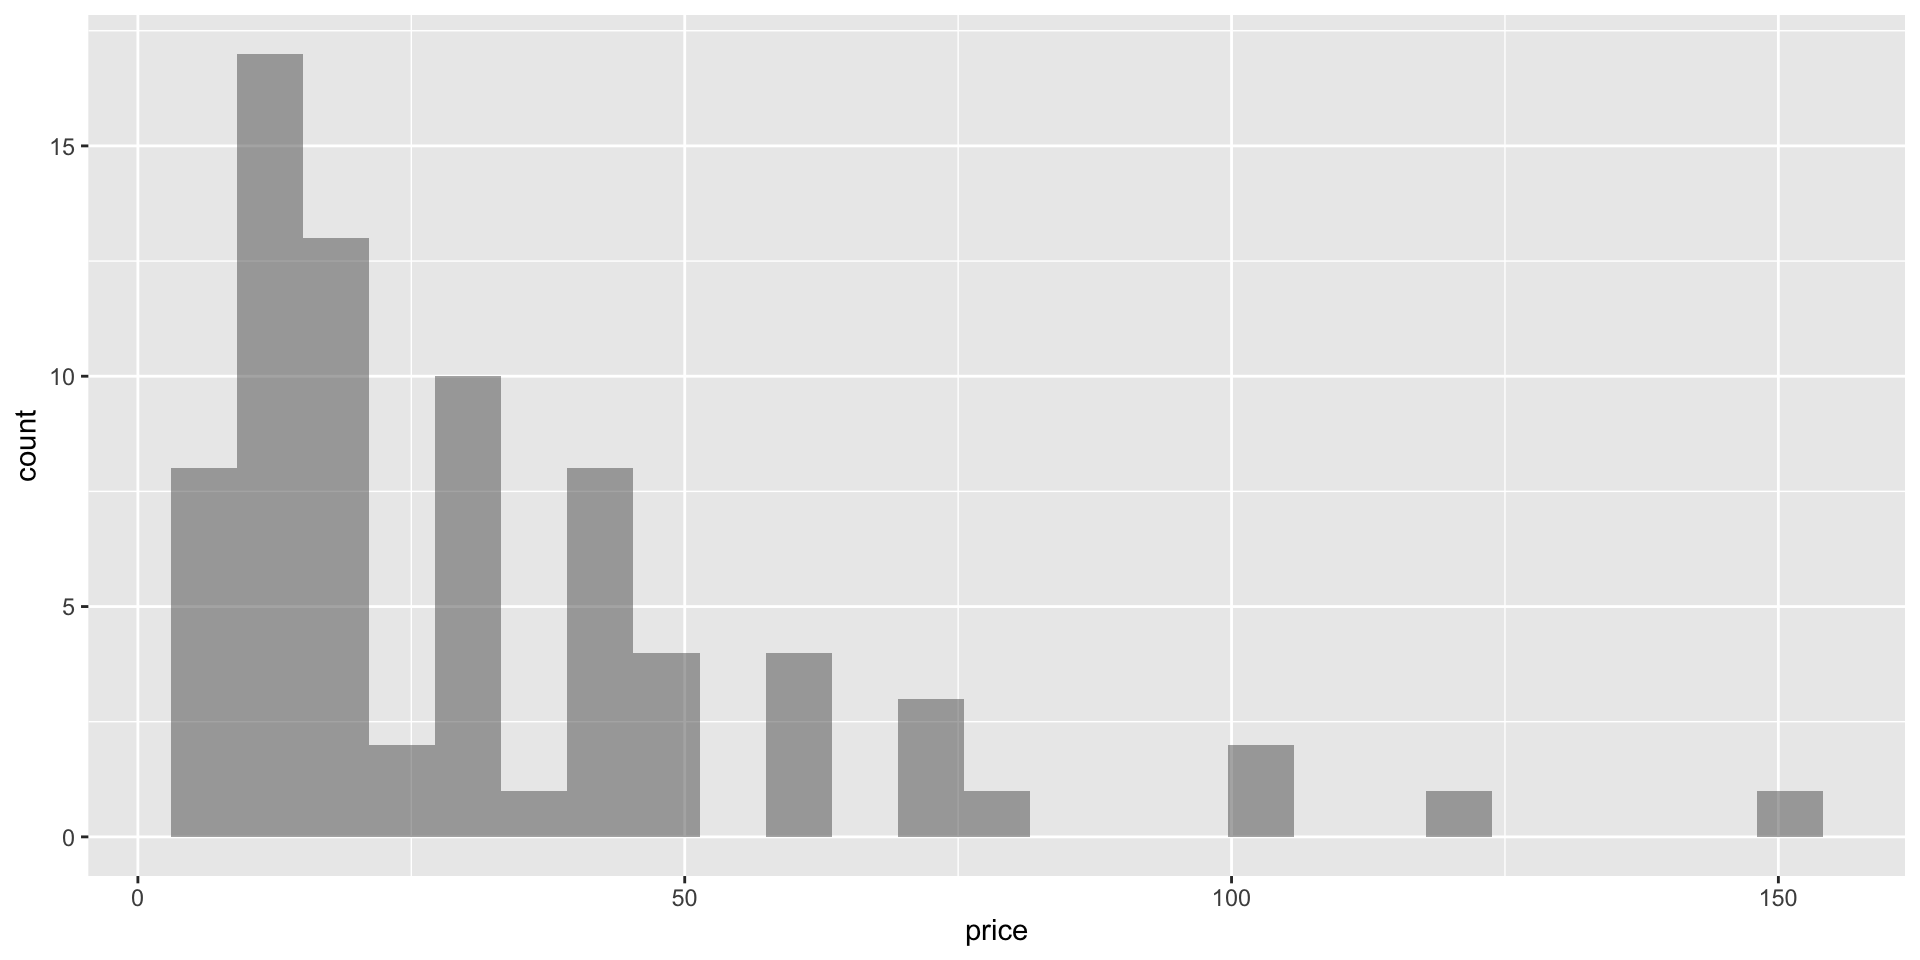
gf_histogram(~price, data = lego)

Density Plot

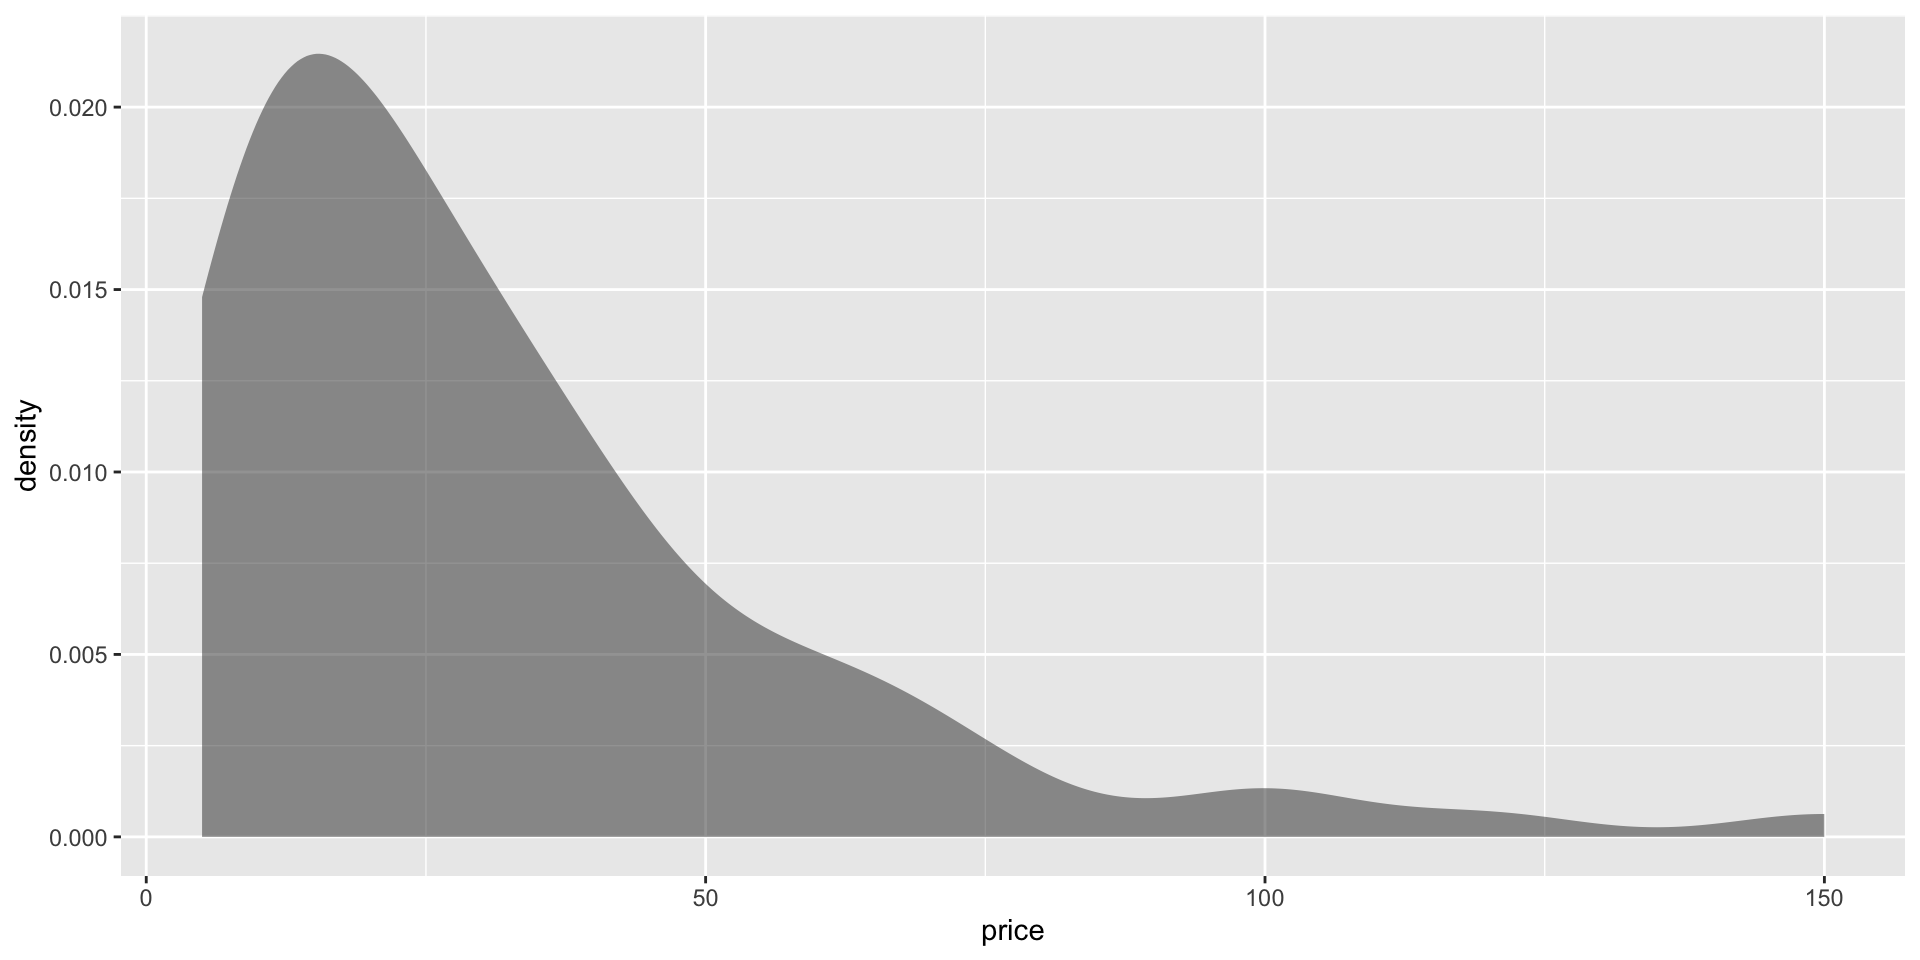
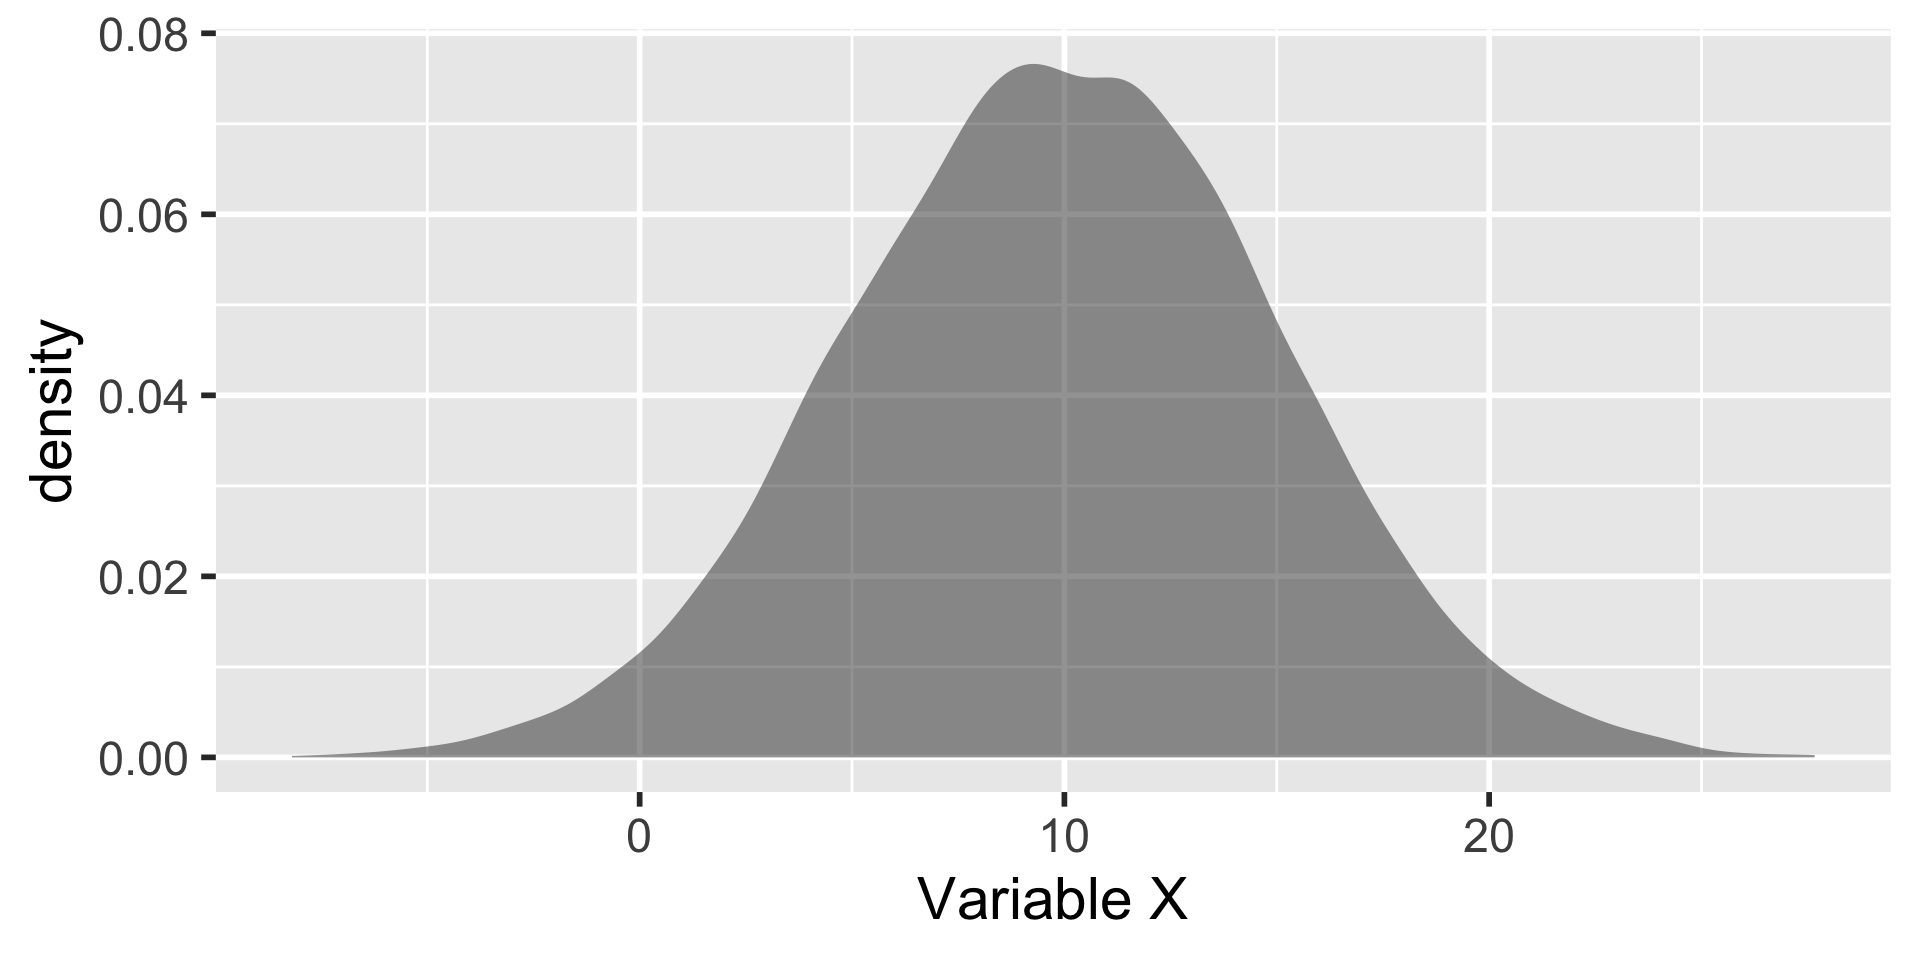
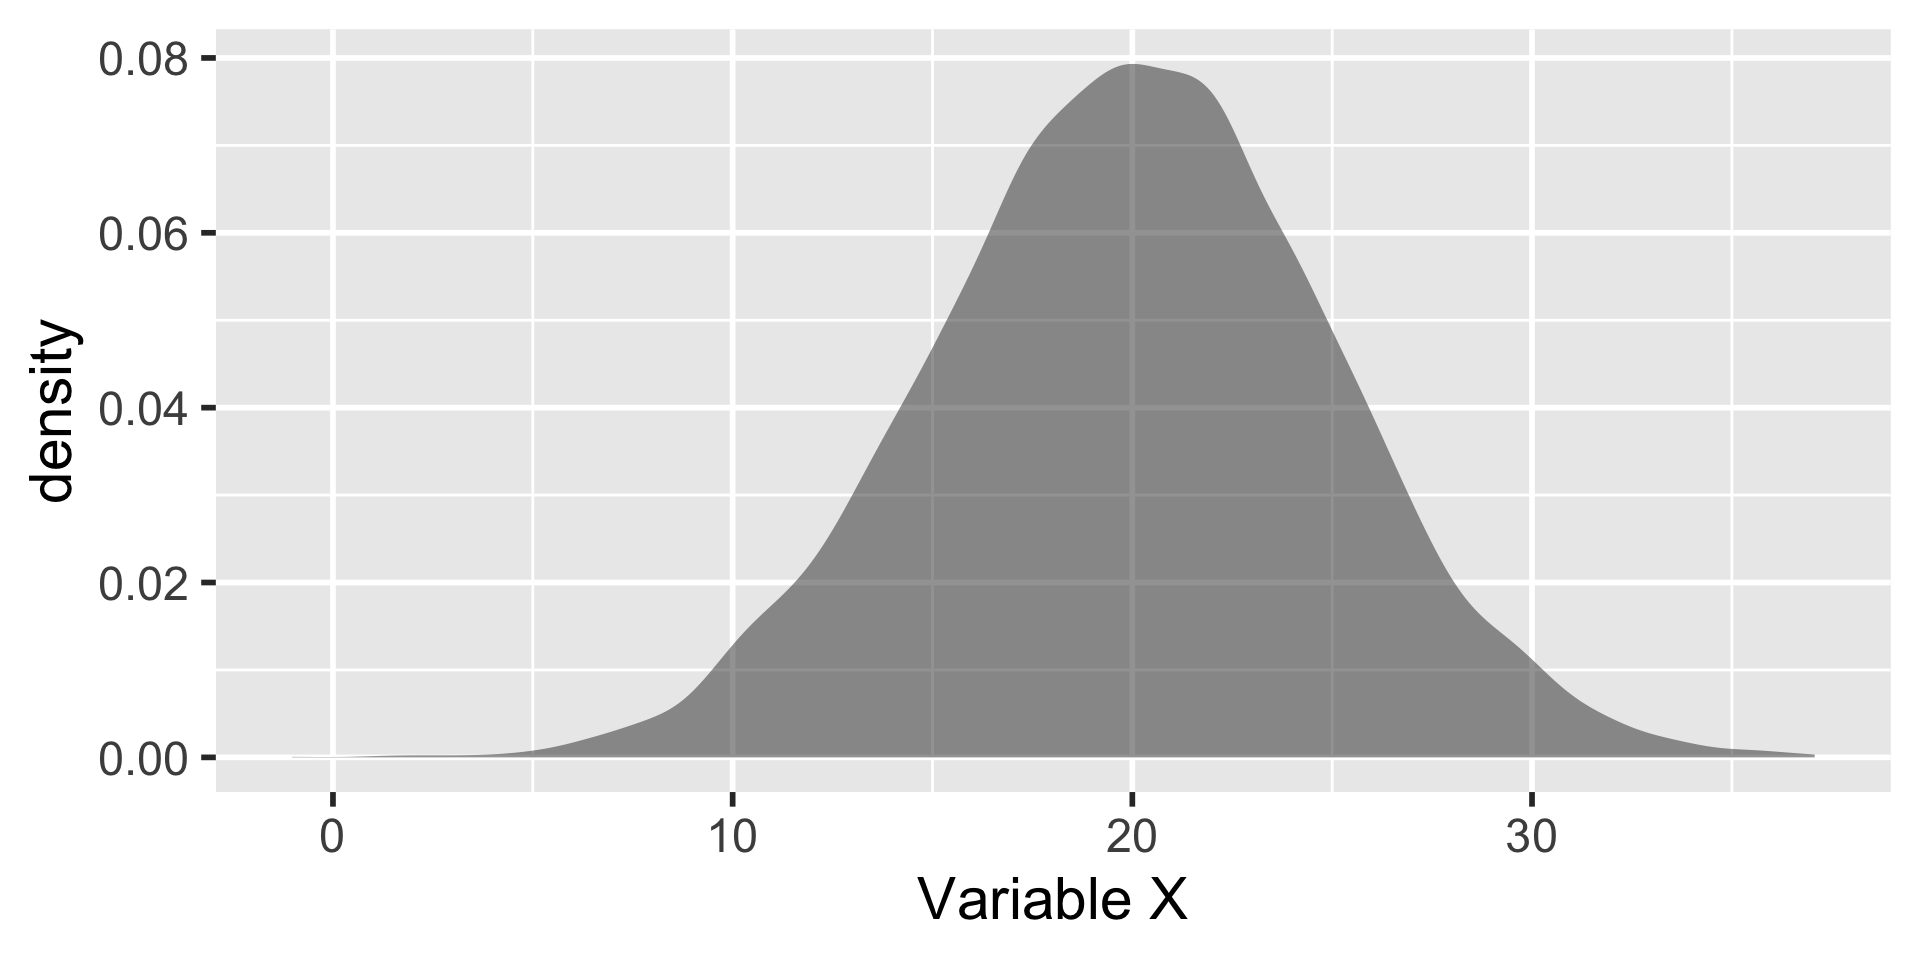
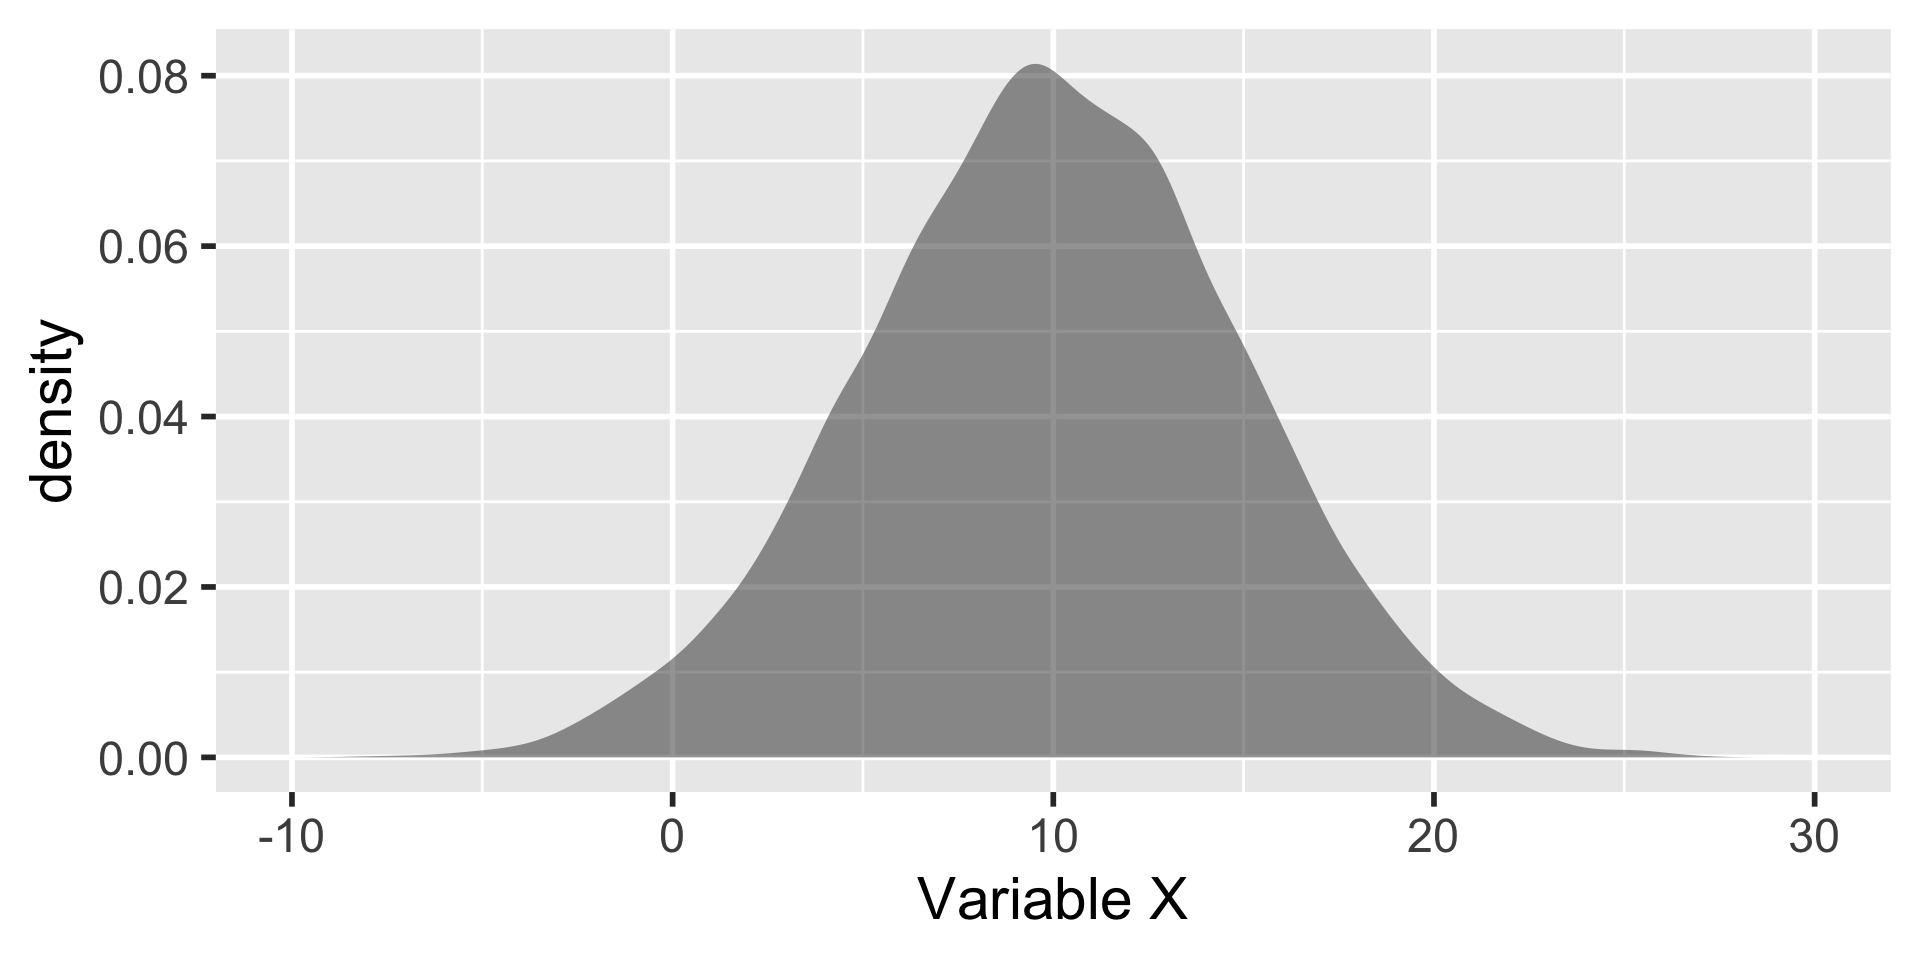
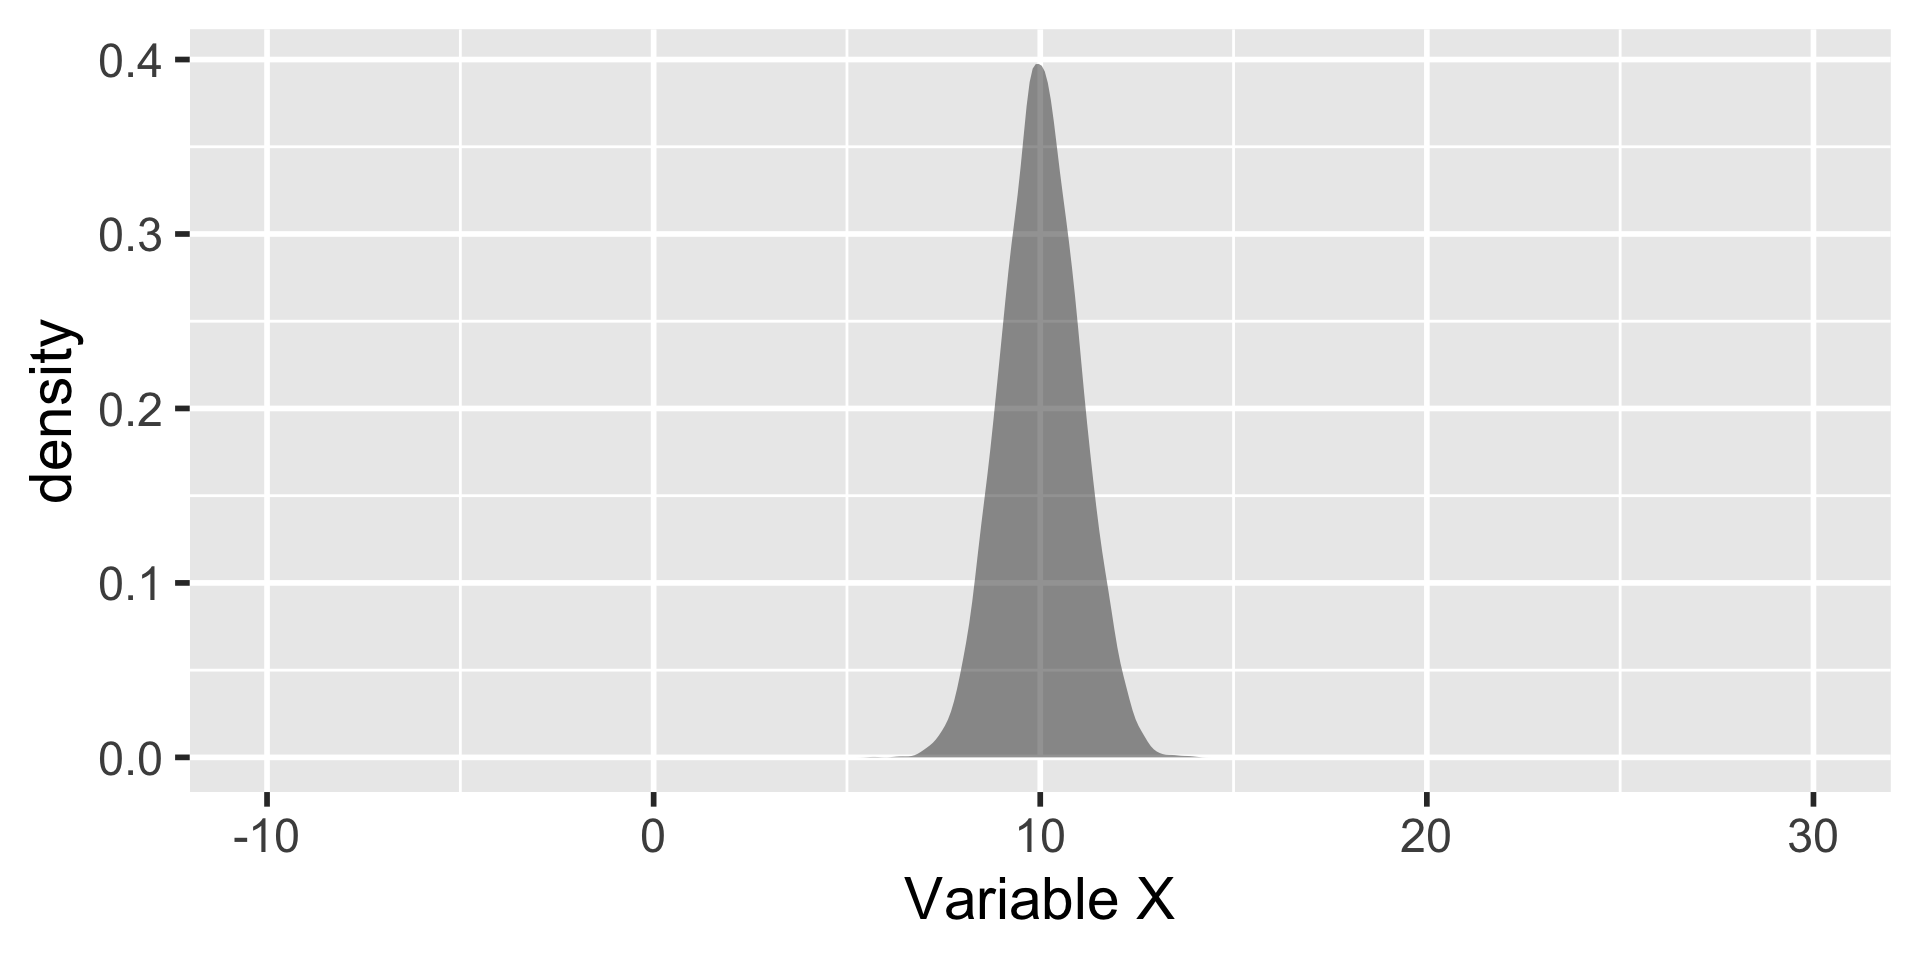
gf_density(~price, data = lego)

Graphs for Quantitative Variables

  • These graphs allow us to see the distribution of the data.
  • We want to know what the variable “looks like”.

What is the big difference between these two graphs?

Shape of a Distribution

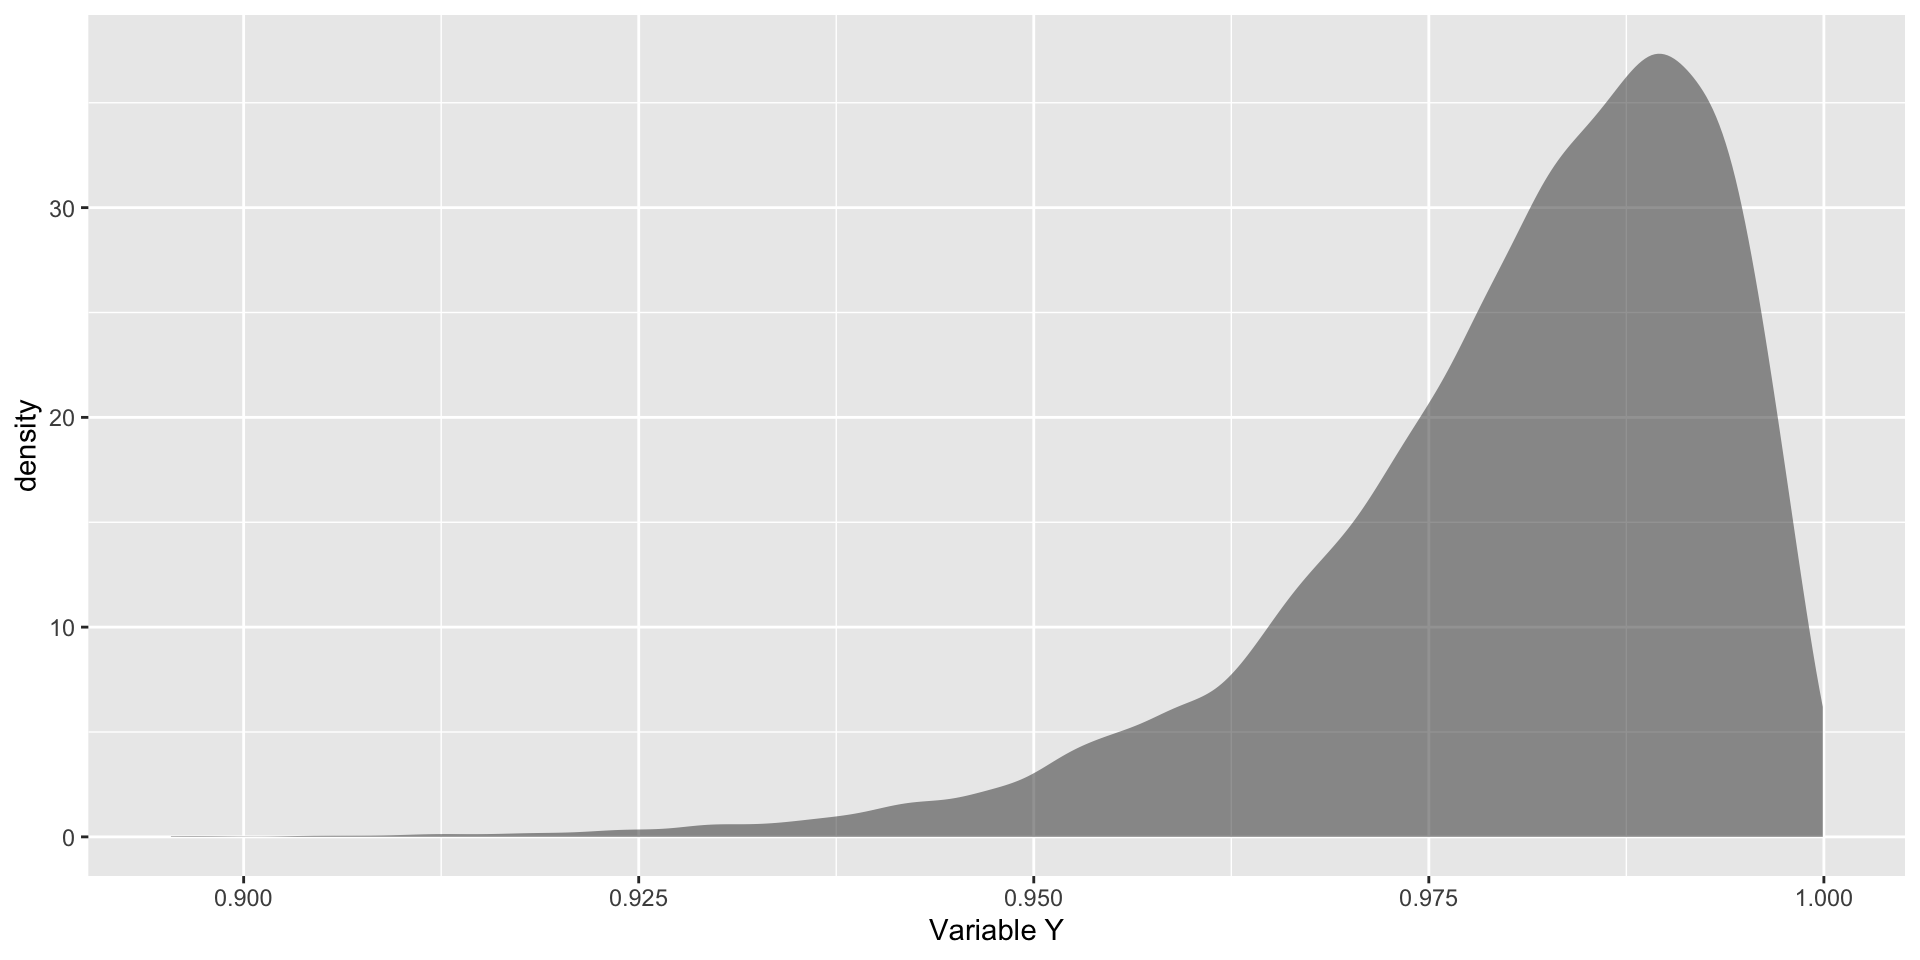
The tail is on the right.

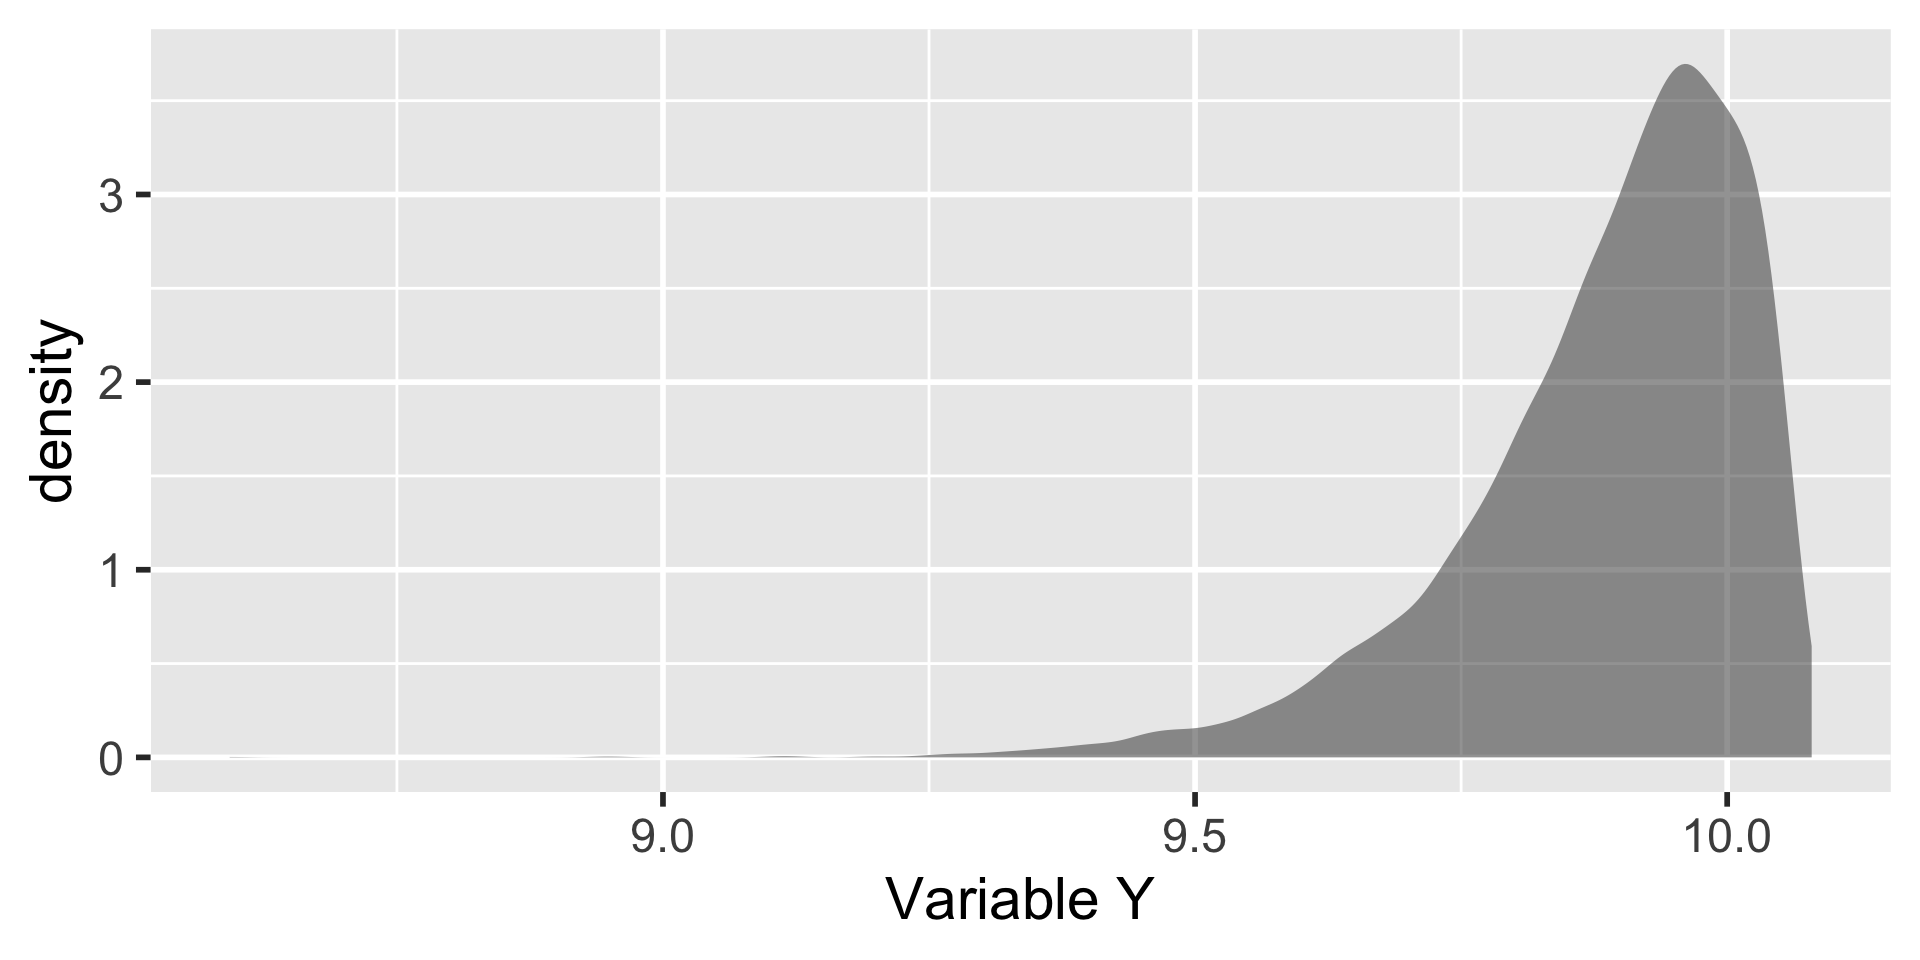
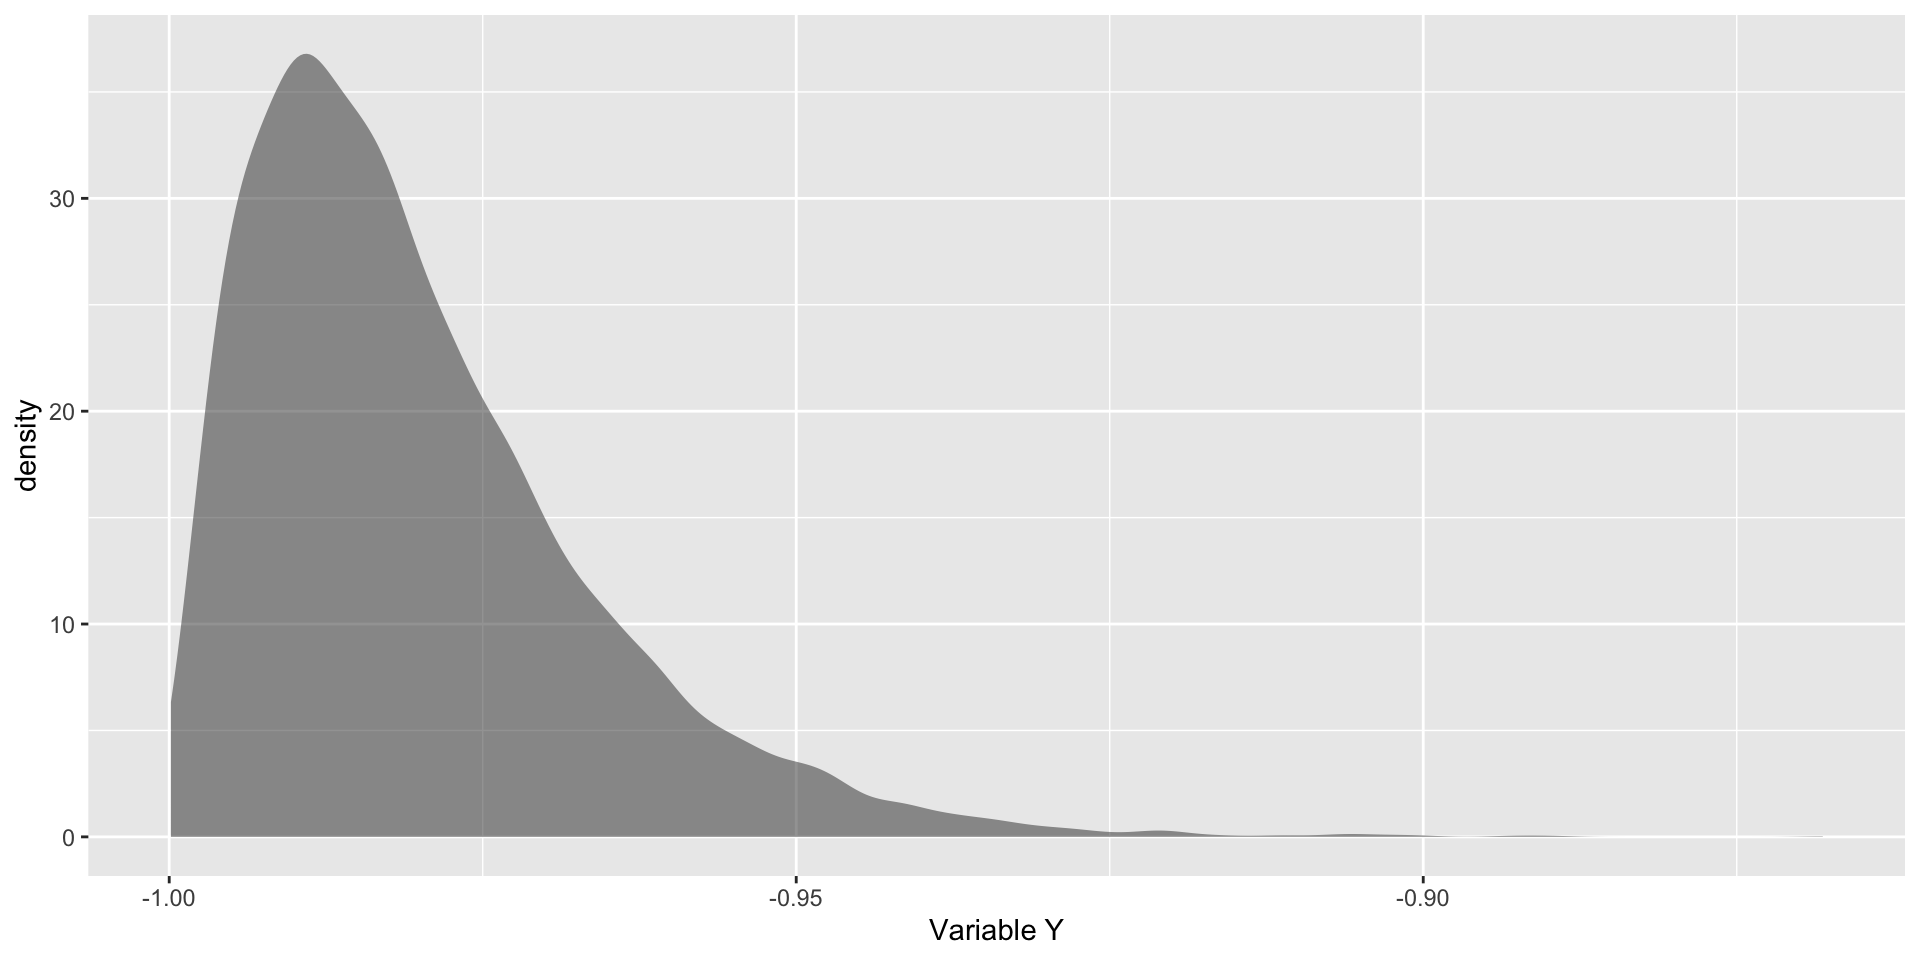
The tail is on the left.

Modality

What is the big difference between these two graphs?

Center

  • A value in the distribution that is “typical”
  • Often measured by the:
    • Mean: Average of all data points
    • Median: Middle value of the data (if put in numerical order)

What is the big difference between these two graphs?

Variability

  • A measure of how distinct the points in your dataset are
  • Often measured by the:
    • Range: The distance between the smallest and largest data value
    • Standard deviation: A measure of the average distance each point is from the mean
    • IQR: The distance between the the 25th and 75th percentile values (i.e., middle 50% of the data)

Describing Distributions Activity

Summary

  • The three key features of a distribution
    • Shape: symmetric/skewed? Unimodal/bimodal?
    • Center: at what single point is most of the data?
    • Variability: what range best describes where the majority of the data falls?
  • When to use the mean or median to describe the center of a distribution
    • If we have a skewed distribution we will use the median to describe the center
    • If we have a symmetric distribution we could use either mean or median, but the mean is the most often used
  • When to use the standard deviation or IQR to describe the variability of a distribution
    • If we have a skewed distribution we will use the IQR to describe the variability
    • If we have a symmetric distribution we could use either IQR or standard deviation, but typically we use the standard deviation