Day 07
Estimating Uncertainty
EPSY 5261 : Introductory Statistical Methods
Learning Goals
At the end of this lesson, you should be able to …
- Define sampling variability.
- Explain how we can estimate uncertainty.
- Calculate an estimate for uncertainty using R Studio.
Mini Activity
Get your pulse rate (beats per minute)
- Find your pulse
- I will time 1 minute on the clock
- Write down your pulse rate for that minute
GOAL: Find the Average Pulse Rate for the Class
- We don’t have time for you all to get everyone’s pulse .
- Collect a sample of 5 classmates’ pulse rates.
- Calculate the average.
Did we all get the same mean?
- NO!
- Why not?
- Sampling Variability!
- Our mean pulse rate will vary from sample to sample
How “different” are these estimates?
- Because of sampling variability we have uncertainty in our estimates.
- But how much uncertainty?
- How different are these estimates?
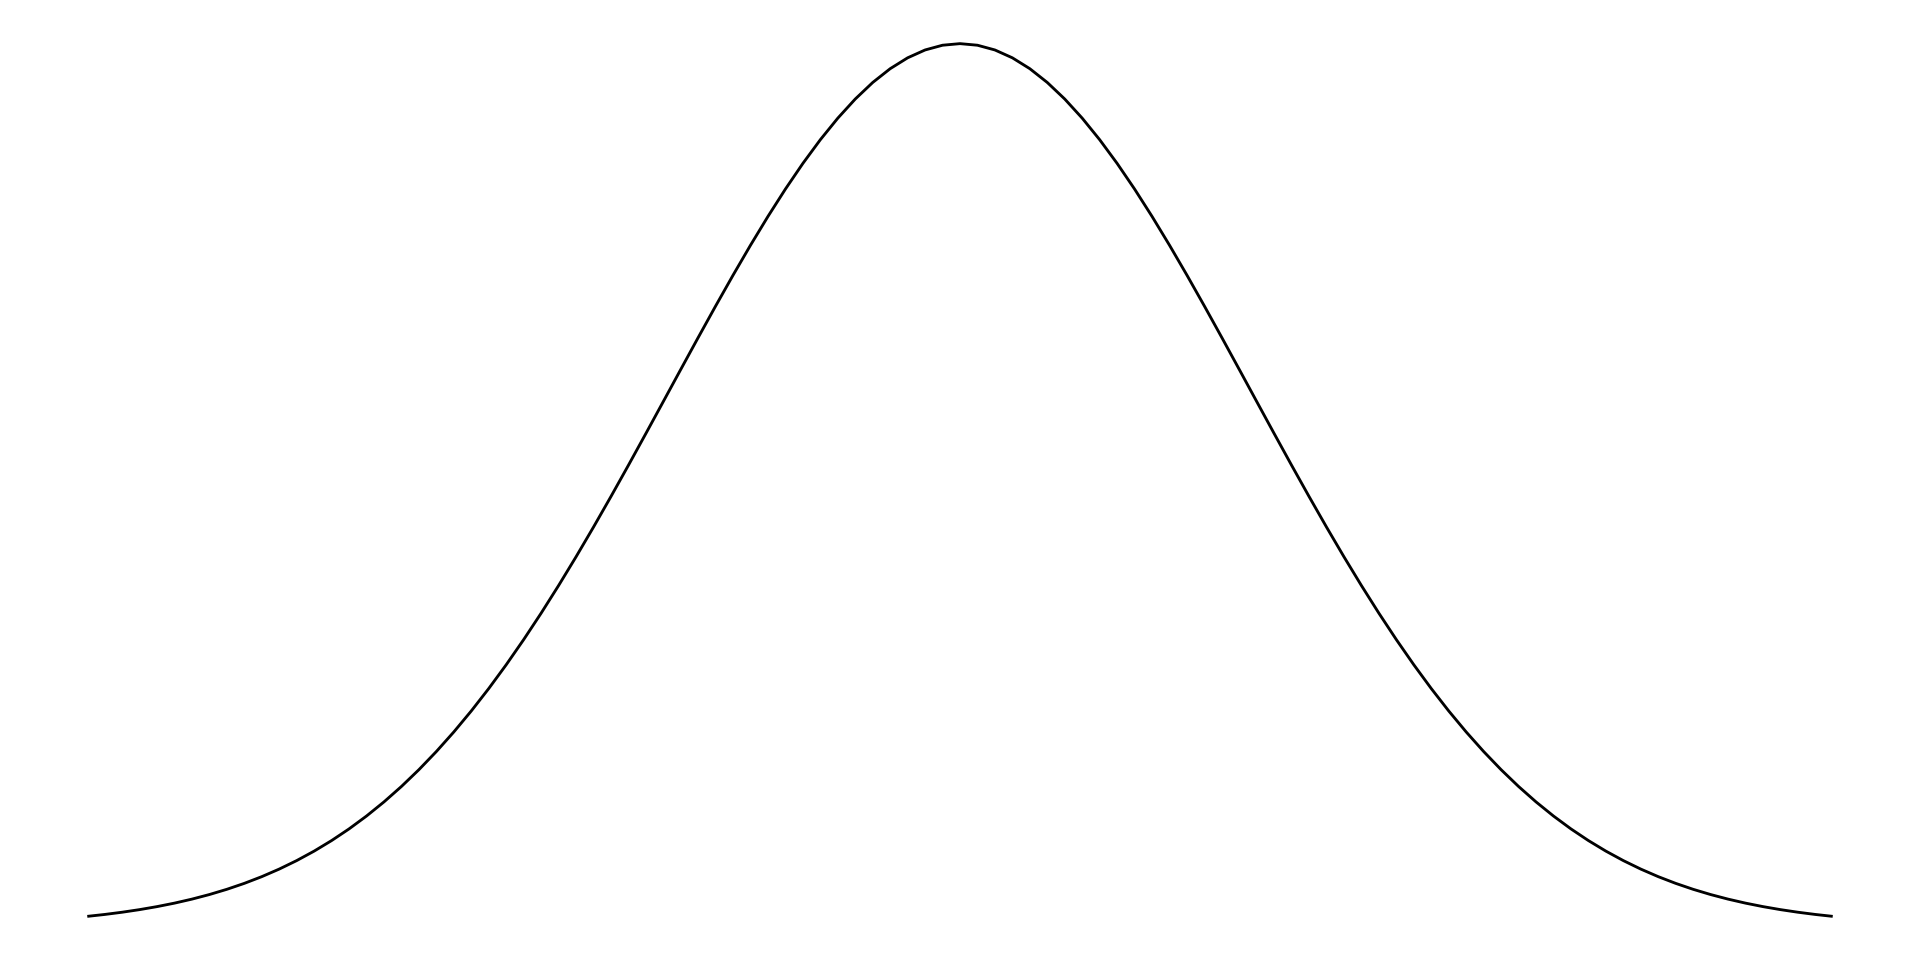
Distribution of Average Pulse Rates
Imagine if we plotted the distribution of averages we got.
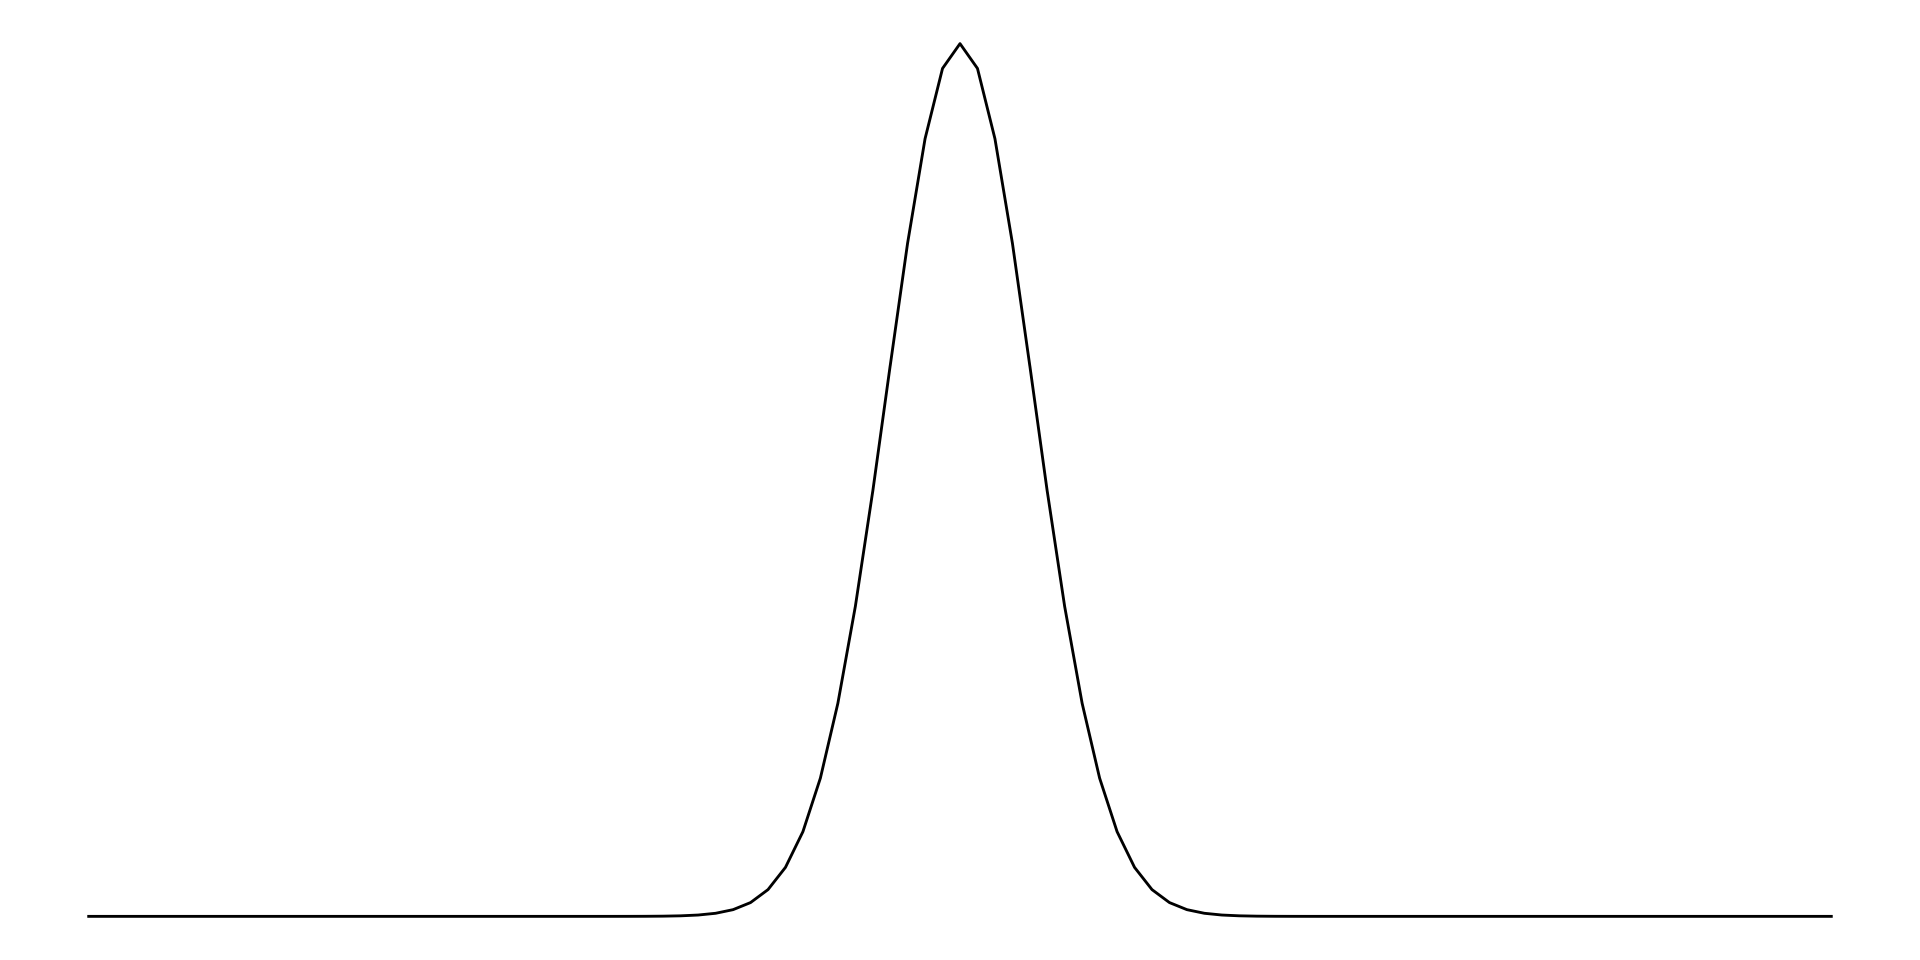
Which of these distributions has more uncertainty? Which has less?
Estimating Uncertainty
- Once way to estimate the uncertainty is with the standard error.
- We obtain the standard error through a process called bootstrapping.
- We will explore that in the Estimating Uncertainty Activity.
Simulation: Understanding Bootstrapping
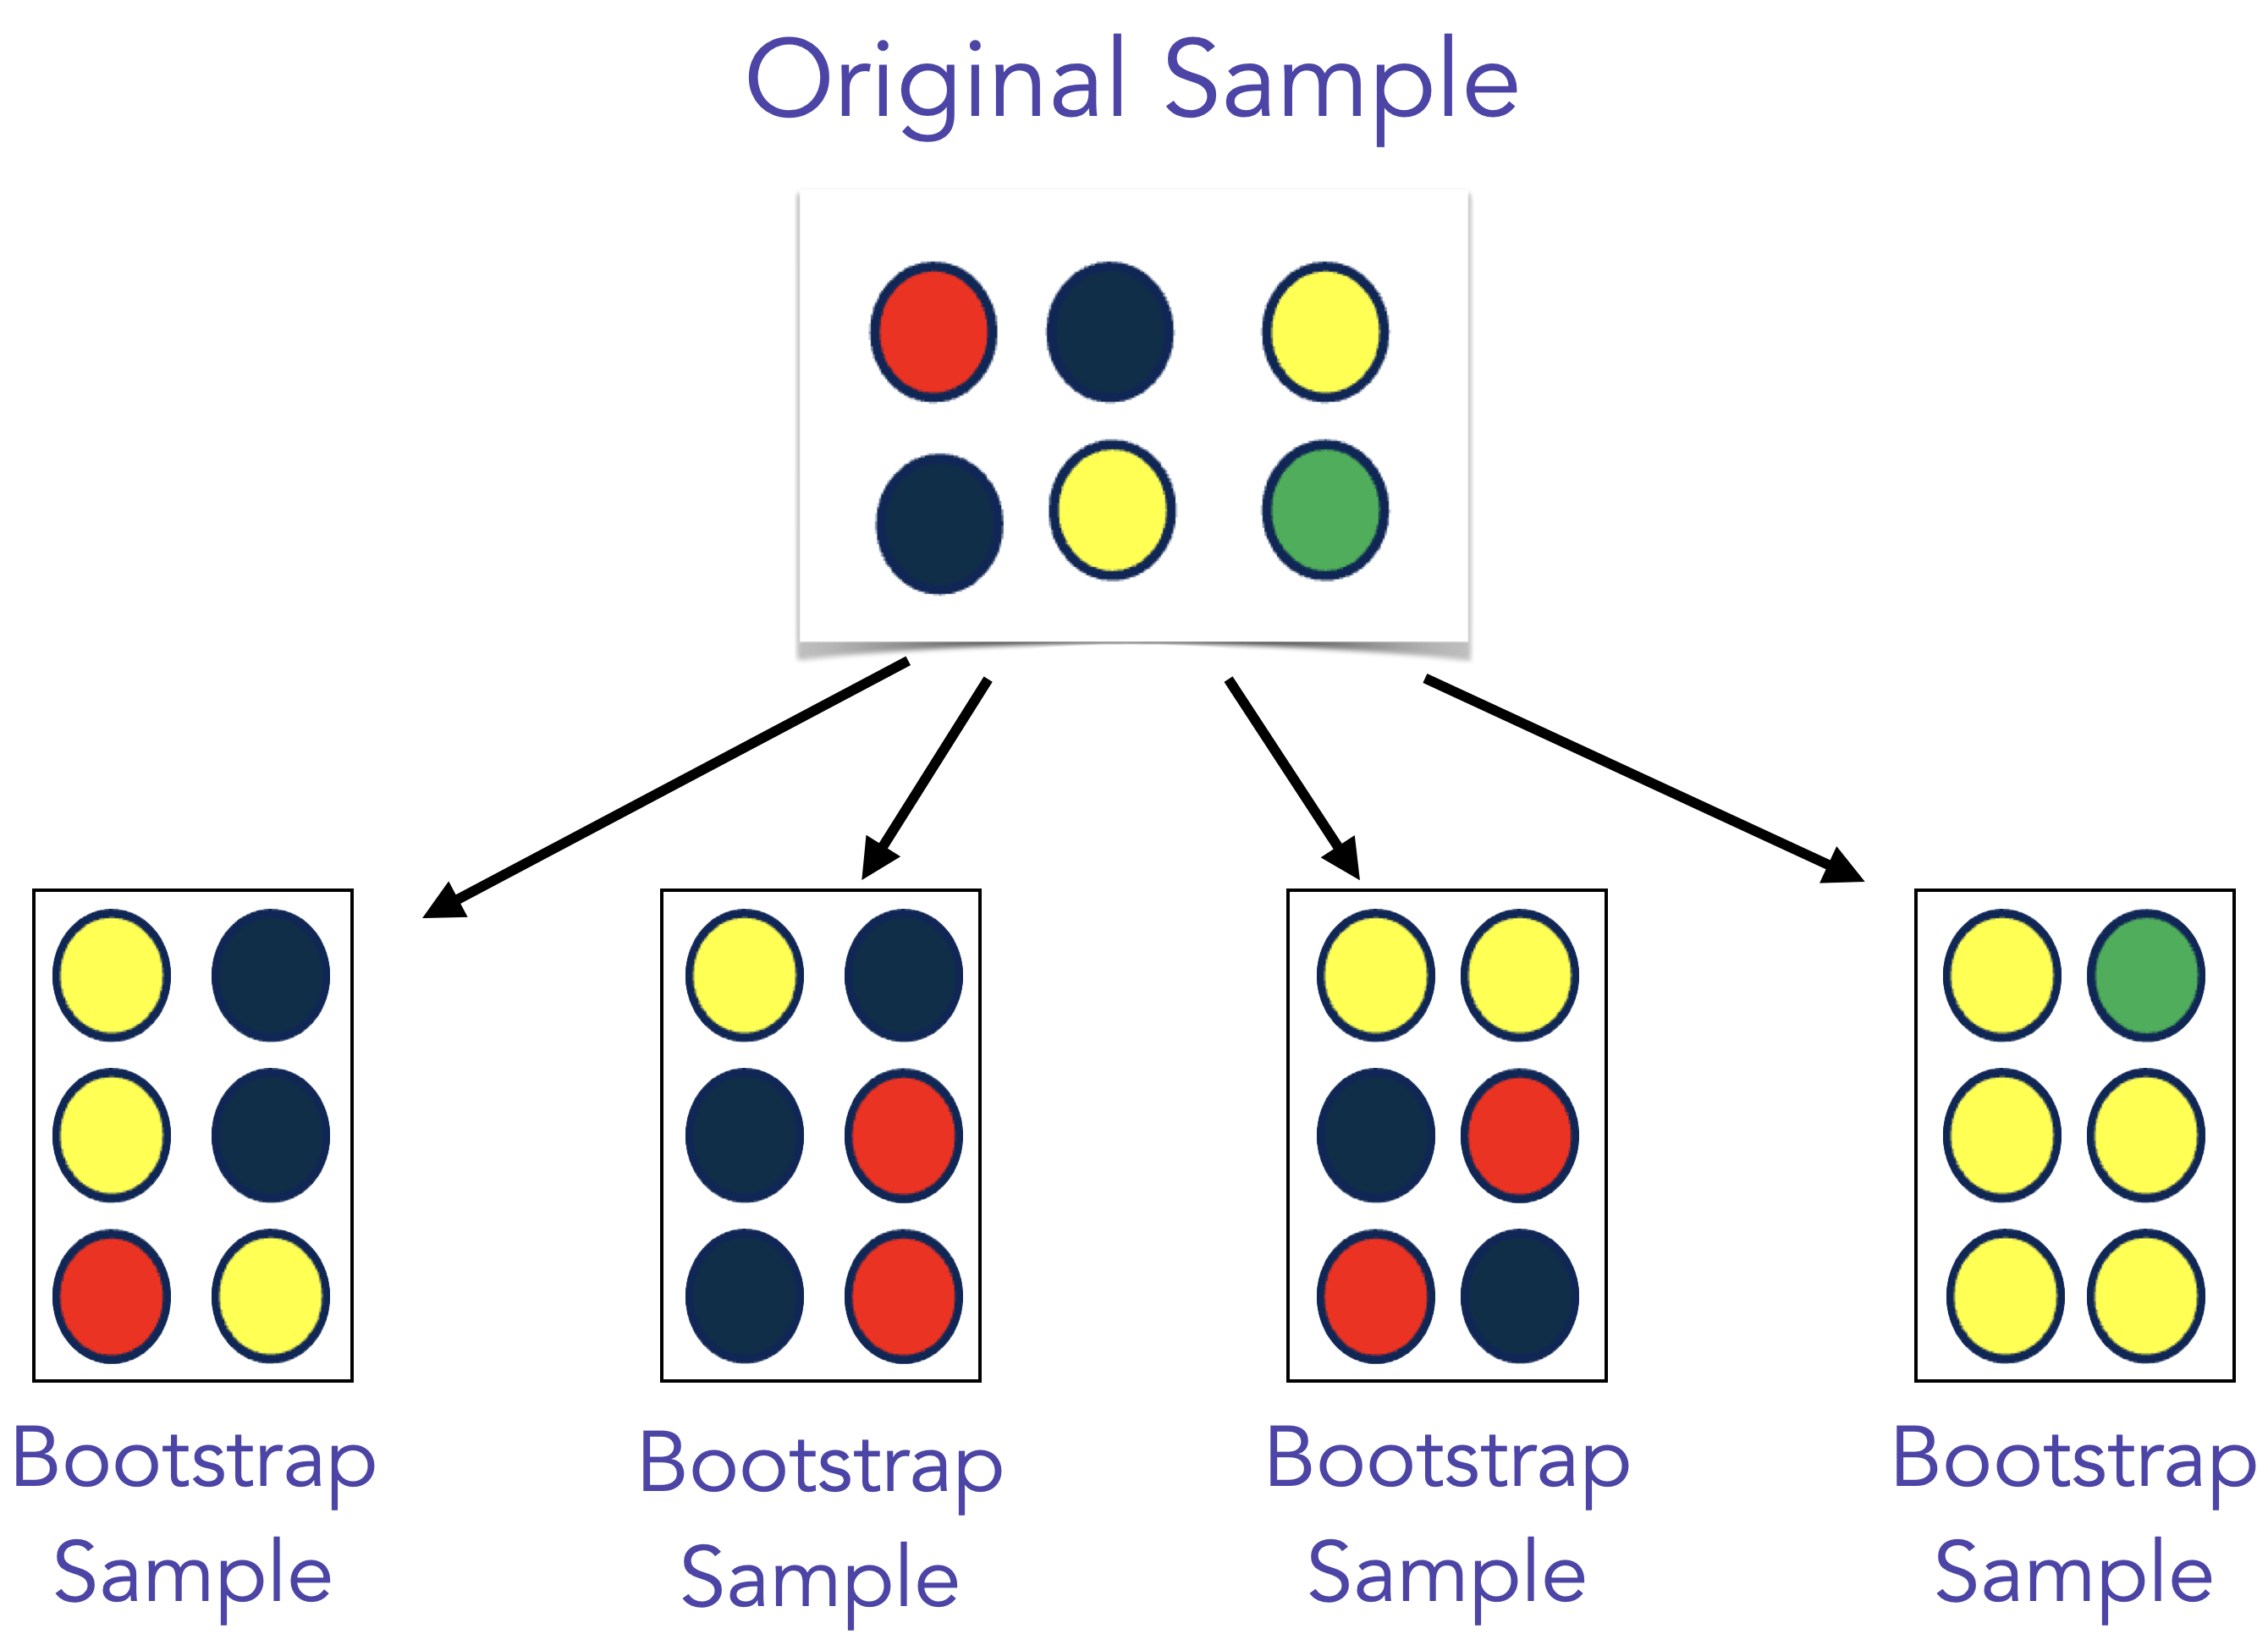
Bootstrapping
- Bootstrapping mimics the process of sampling repeatedly from the population.
- From this, we can estimate the sampling variability.
- Bootstrap samples are generated by sampling with replacement from the original sample, using the same sample size.
- FINAL GOAL: Provide an estimate for uncertainty.
Bootstrapping

Bootstrapping (cntd.)
Bootstrap (cntd.)
- Once we have a bootstrap sample we can calculate the sample statistic of interest (in our color example it might be proportion of yellow).
- Complete the bootstrap sample process (draw a bootstrap sample and record the sample statistic of interest) MANY times.
- Once you are done you have a collection of MANY bootstrap samples.
- The standard deviation of this collection of bootstrap samples is your estimate for uncertainty! We call this the standard error.
Estimating Uncertainty Activity
Summary
- Sampling variability (uncertainty) is the idea that sample estimates vary from sample to sample.
- We can estimate this uncertainty by calculating the standard error.
Looking Ahead
- The data we are working with is from 2017.
- You are curious if the average pulse for U.S. adults has changed since 2017.
- You conduct your own study and get an average pulse of 74 beats per minute.
- But how can you determine if this is a difference due to sampling variability or a true difference?
- We will explore that next class via hypothesis testing!