
Day 08
Introduction to Hypothesis Testing
EPSY 5261 : Introductory Statistical Methods
Learning Goals
At the end of this lesson, you should be able to …
- Describe the purpose of a hypothesis test.
- List the steps of a hypothesis test.
Review
- Parameter: A population level summary of data
- \(\mu\): Population mean
- \(\pi\): Population proportion
- Statistic: A sample level summary of data
- \(\bar{x}\): Sample mean
- \(\hat{p}\): Sample proportion
Test a Claim
In research we often want to test a claim:
- Is the true average body temperature really 98.6?
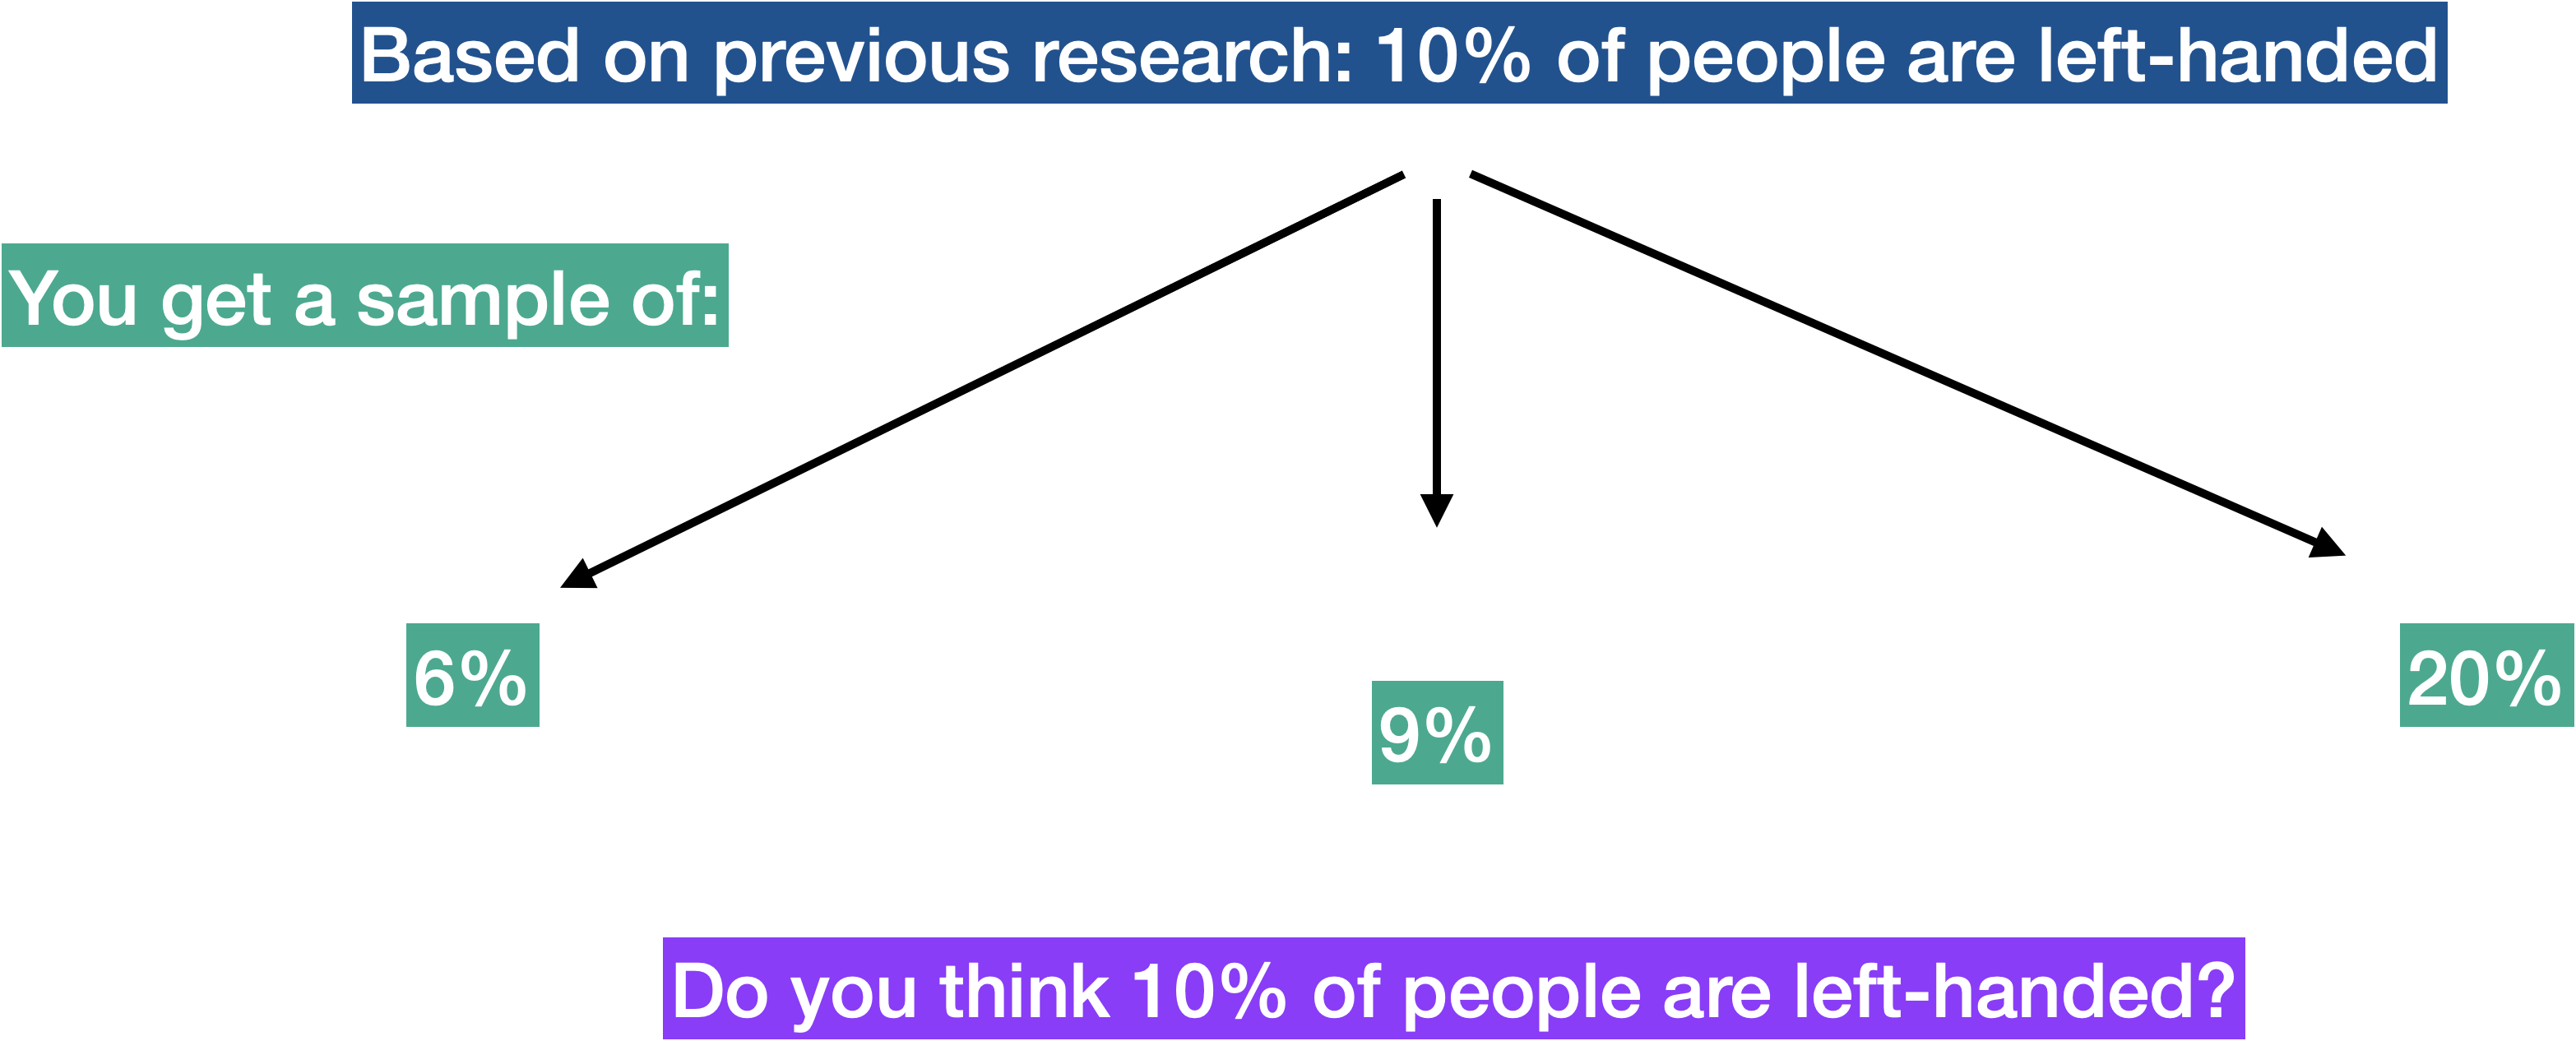
- Is 10% of the world left-handed?
- Is a new treatment more effective than an old treatment for a particular disease?
How to Test a Claim
To test a claim we often start by getting a sample of data from our population of interest. We then summarize the sample data to evaluate the claim. But do we need to account for?
SAMPLING VARIABILITY
Mini Example Scenario
Recap
What did we do on the last slide?
- Considered the “existing standard”
- Compared our sample to that “existing standard”
- Decided whether our sample evidence “fits” with the “existing standard”
- Did our sample evidence seem likely if that “existing standard” is true?
Review → Hypothesis Testing
Purpose of Hypothesis Testing
To test a claim about a population parameter
Steps of Hypothesis Testing
- Formulate a research question
- Write your hypotheses
- Find sampling distribution assuming the null hypothesis is true
- Compare sample summary to the distribution under the null hypothesis
- Get a p-value
- Make a decision based on the p-value
- Communicate your conclusion in context
Hypothesis Testing Example
Step 1: Research Question
Are 10% of people left-handed?
Step 2: Hypotheses
Null Hypothesis
Usually a statement of no effect, no difference, “status quo” (a statement of equality)
- The “dull” hypothesis
- The “no change” or “no difference” hypothesis
Alternative Hypothesis
There is an effect or difference (a statement of inequality)
- The “exciting” hypothesis
- Often aligns with the researcher’s hypothesis about an effect
Example Hypotheses
Null hypothesis (always uses an = sign)
\[ H_0: \underbrace{\pi}_{\mathrm{Population~parameter\\(proportion~in~this~case)}} = \underbrace{0.10}_{\mathrm{Hypothesized~value}} \]
Alternative hypothesis (sign based on the research question)
\[ H_A: \pi \neq 0.10 \]
Example Hypotheses (cntd.)
In other cases the alternative might be:
- \(H_A: \pi < 0.1\)
- \(H_A: \pi > 0.1\)
Step 3: Sampling Distribution
- Referred to as a sampling distribution and is obtained by
- Simulation (next class)
- Mathematical formula (after next class)
- Allows us to estimate the sampling variability we expect given our sample
- Centered at the null hypothesized value
Step 4: Compare Sample Statistic

Step 5: p-Value
- Calculated based on the sampling distribution (based on the null hypothesis)
- Tells us how likely our sample statistic is, given the null hypothesis is true
- Compared to a significance level or alpha-value (typically \(\alpha = 0.05\))
Step 6: Decision

Step 7: Conclusion
- If we REJECT the null hypothesis → we conclude in favor of the alternative hypothesis (often called “statistical significance,” although a better term may be “statistical discernibility”)
- If we DO NOT REJECT the null hypothesis → we conclude there is NOT enough evidence to reject the null hypothesis
Example Conclusion
Recall the research question (Are 10% of people left-handed?) and statistcal hypotheses:
\[ \begin{split} H_0: \pi &= 0.10 \\ H_A: \pi &\neq 0.10 \end{split} \]
- Suppose our p-value was 0.230.
- Since this is larger then 0.05 (our alpha value):
- We decide to not reject the null hypothesis.
- There is NOT enough evidence to conclude that the proportion of people who are left-handed is different from 0.10.
Hypothesis Testing Activity
Summary
- There are many steps to the hypothesis test (overview on Slide 9).
- Hypothesis tests help us test a claim while taking into account sampling variability.
- They provide one form of evidence to help answer a research question.