Day 09
Simulation-Based Hypothesis Testing
EPSY 5261 : Introductory Statistical Methods
Learning Goals
At the end of this lesson, you should be able to …
- Describe the purpose of a hypothesis test.
- List the steps of a hypothesis test.
- Describe a simulation approach to hypothesis testing
Purpose of Hypothesis Testing
To test a claim about a population parameter
Steps of Hypothesis Testing
- Formulate a research question
- Write your hypotheses
- Find sampling distribution assuming the null hypothesis is true
- Compare sample summary to the distribution under the null hypothesis
- Get a p-value
- Make a decision based on the p-value
- Communicate your conclusion in context
Hypothesis Testing Example
Estimating Sampling Variability
- Goal: Get an estimate for the sampling variability expected given this sample
- Simulation (resampling methods)
- Traditional Parametric Methods (a mathematical function)
Recall: Day 5 Activity
- We have used simulation to get an estimate for variability before!
- We will do the same process here with 1 minor change to ensure we are centered at the null hypothesized value (not out sample statistic).
Sampling Distribution
- Recall: in the Day 5 activity when we resampled we had a distribution centered at the sample statistic.
- In hypothesis testing we want a distribution centered at the null hypothesized value.
Example
Step 1: Research Question
A data scientist collected data from a sample of 50 married U.S. men and found their average age of marriage was 32 years. However, data from a national survey in 2015 suggests the average age men get married in the U.S is 29 years. You are now curious if the average age for men to marry has increased.
Research Question: Is the average age men in the U.S. marry greater than 29 years?
Step 2: Statistical Hypotheses
\[ \begin{split} H_0: \mu &= 29 \\[2ex] H_A: \mu &> 29 \end{split} \]
Step 3: Sampling Distribution
- GOAL: We want to know what are possible values for the sample mean if the null hypothesis is true.
- One method for this is to sample with replacement from a dataset with the same mean as our null hypothesis.
- To preserve the variability of our original sample, we can use our sample and adjust it to have a mean of 29.
Step 3: Sampling Distribution (cntd.)
- Our sample mean is 32
- The hypothesized mean from the null hypothesis is 29
- To go from 32 to 29, we need to shift our data by \(-3\) (\(29-32= -3\))
Step 3: Sampling Distribution (cntd.)
- Sample Data: 30, 34, 29, 30, …
Shift by \(-3\)
- Adjusted Data: 27, 31, 26, 27, …
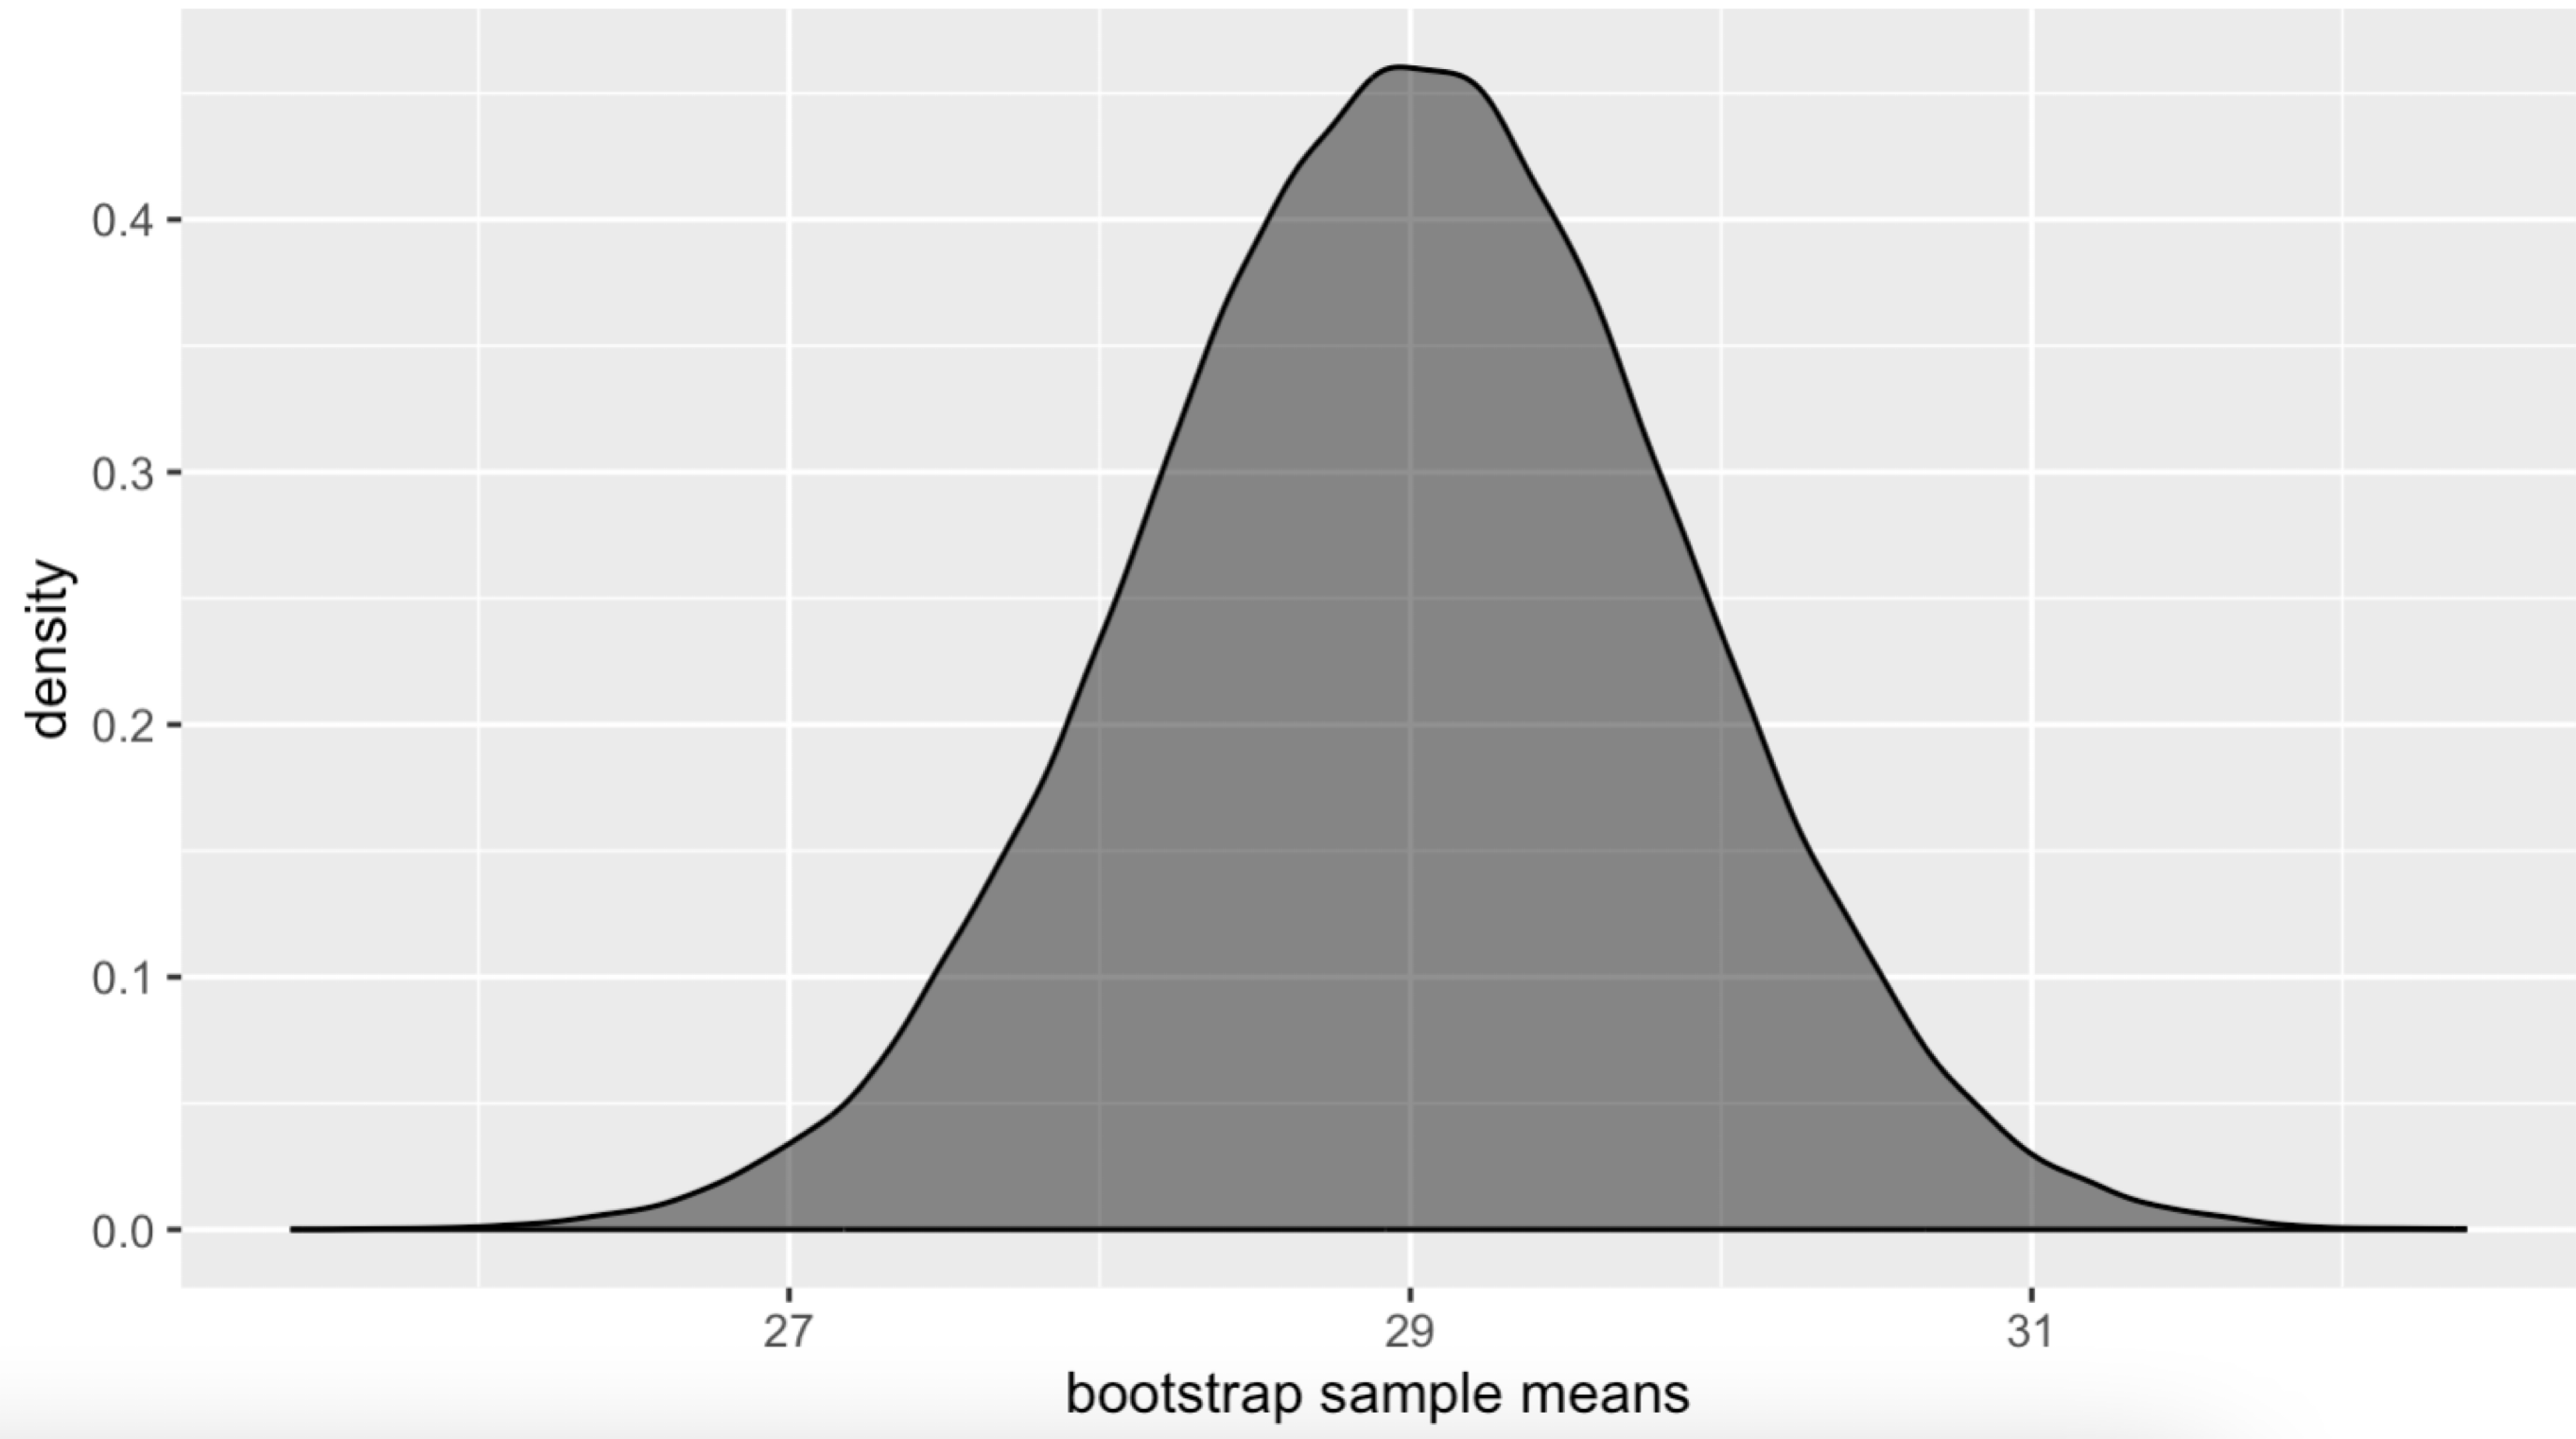
Step 3: Sampling Distribution (cntd.)
Then we can sample with replacement from this adjusted sample, and calculate the mean. We repeat this process until we have MANY means. This will give us a sense of what mean ages we would expect if the true average age is 29.
Step 3: Sampling Distribution (cntd.)
Step 4: Compare Sample Statistic

Step 5: p-Value
Recall: The p-value tells us how likely our sample mean (or one that is more extreme) is, if the null hypothesis is true.
- In other words, if the true mean is 29, the the p-value quantifies the chance we get a sample mean of 32 or greater.
- R Studio will calculate this for us.
- In our example, \(p=0.0018\).
Step 6: Decision
- This is a small p-value (smaller then our \(\alpha\)-value of 0.05).
- This gives us a lot of evidence against the null hypothesis
- So we reject the null hypothesis.
Step 7: Conclusion (in Context)
- We have evidence that the true average age of men when they get married is likely greater than 29.
Simulation-Based Hypothesis Testing Activity
Summary
- There are many steps to the hypothesis test (overview on Slide 9).
- Hypothesis tests help us test a claim while taking into account sampling variability.
- They provide one form of evidence to help answer a research question.
- Simulation is one method to conduct a hypothesis test (it helps us estimate sampling variability and visualize the null hypothesized model).