Day 11
Hypothesis Testing with the t-Distribution
EPSY 5261 : Introductory Statistical Methods
Learning Goals
At the end of this lesson, you should be able to …
- Describe the purpose of a hypothesis test.
- List the steps of a hypothesis test.
- Describe a parametric approach to hypothesis testing for a single mean.
- List the assumptions for using the t-distribution to test a single mean.
Purpose of Hypothesis Testing
To test a claim about a population parameter
Steps of Hypothesis Testing
- Formulate a research question
- Write your hypotheses
- Find sampling distribution assuming the null hypothesis is true
- Compare sample summary to the distribution under the null hypothesis
- Get a p-value
- Make a decision based on the p-value
- Communicate your conclusion in context
Hypothesis Testing Example
Estimating Sampling Variability
- Goal: Get an estimate for the sampling variability expected given this sample
- Simulation (resampling methods)
- Traditional Parametric Methods (a mathematical function)
Theoretical Distribution
- Up until now, we have looked at approximations of the sampling distribution, with simulation.
- Now, we will look at theoretical distributions of sample statistics
Sampling Distribution
- Recall: in the Day 5 activity when we resampled we had a distribution centered at the sample statistic.
- In hypothesis testing we want a distribution centered at the null hypothesized value.
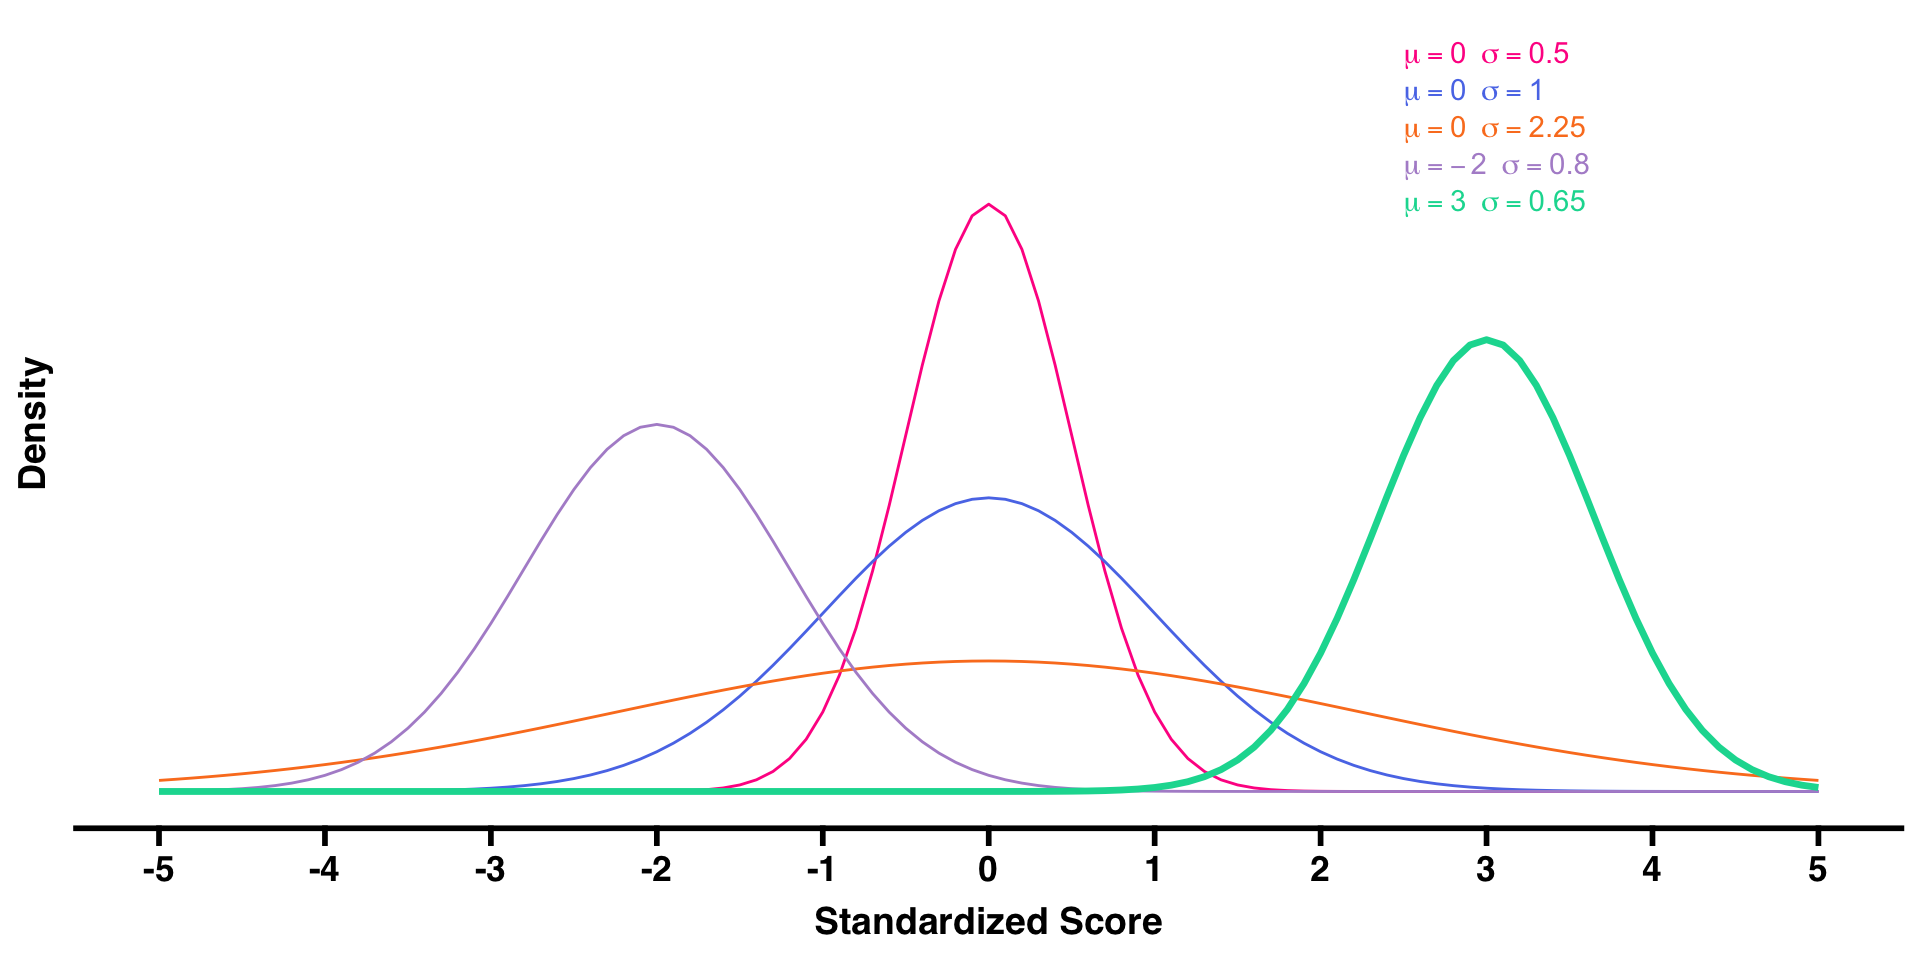
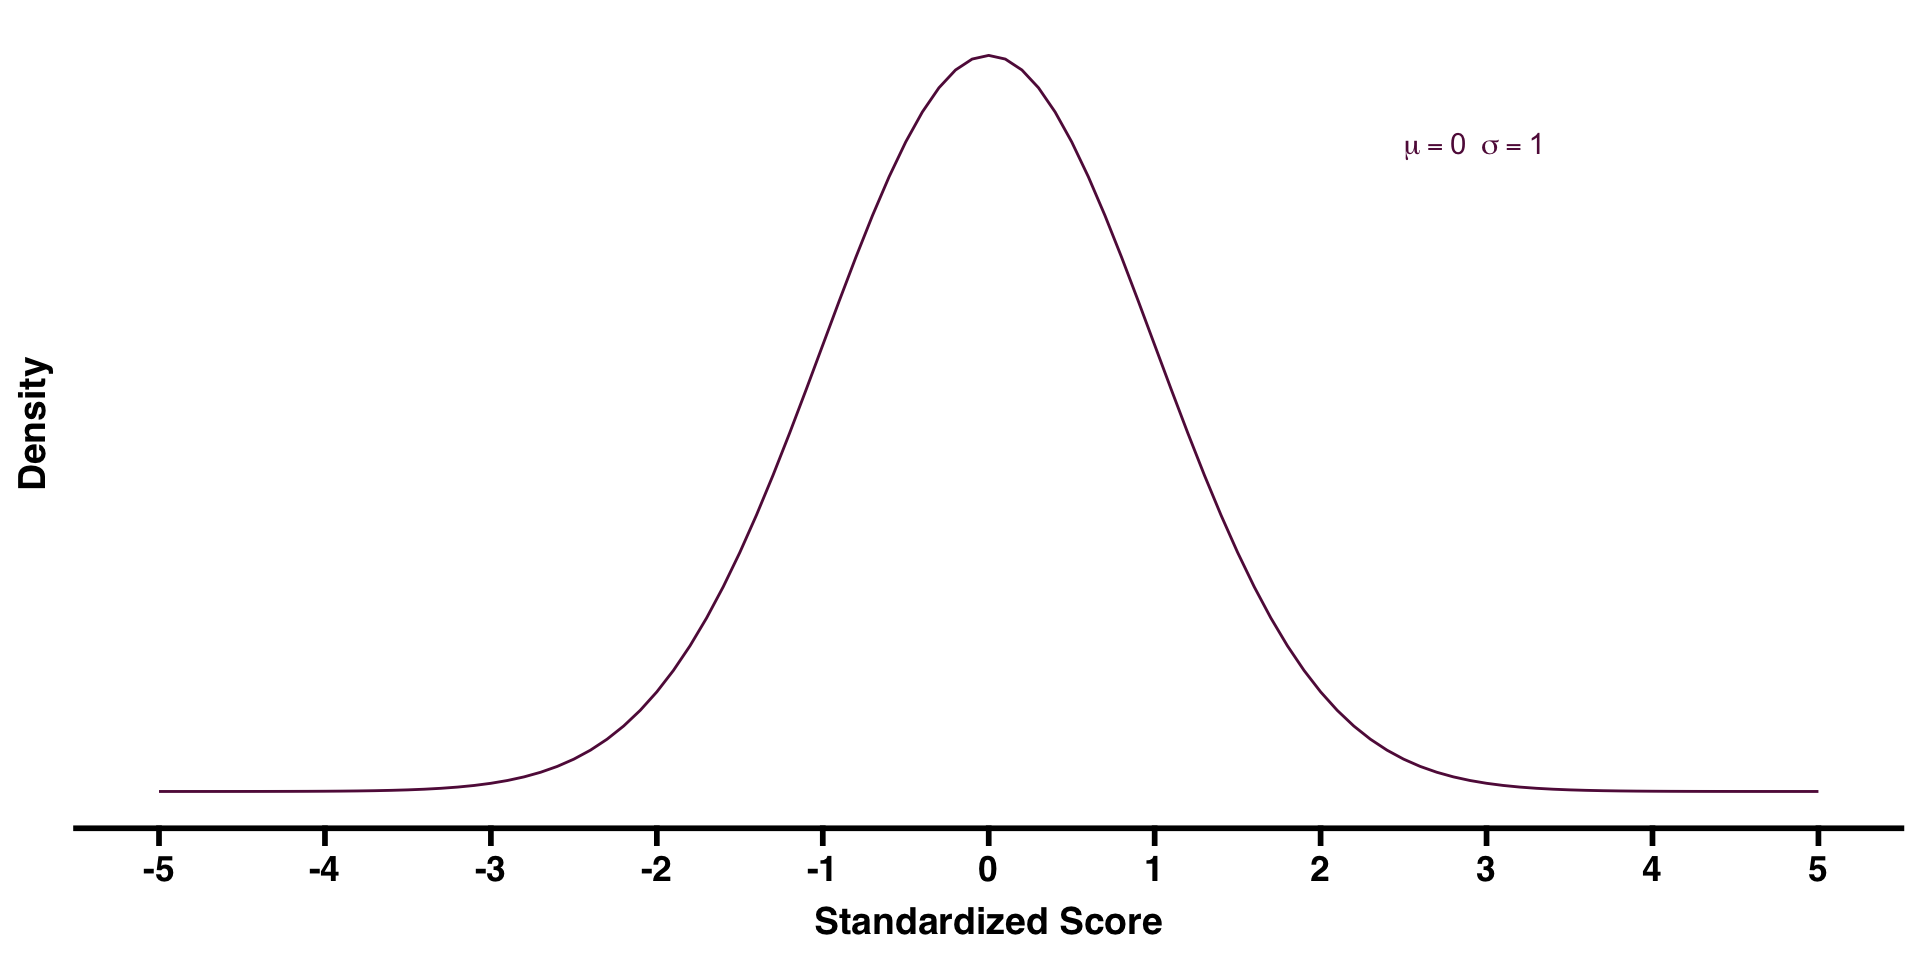
Normal Distributions
- Normal distributions are bell shaped, symmetric distributions characterized by:
- Mean (center)
- Standard deviation (variability)
Normal Distributions


Central Limit Theorem (CLT)
- Mathematical theorem that informs us about the shape, center, and variation in the sampling distribution (i.e., the distribution of sample statistics)
- It says if we know the population mean (\(\mu\) or \(\pi\)) and the population standard deviation (\(\sigma\)) then…
- For random samples with a sufficiently large sample size, the distribution of sample statistics for a mean or a proportion is approximately normally distributed and centered at the value of the population parameter.
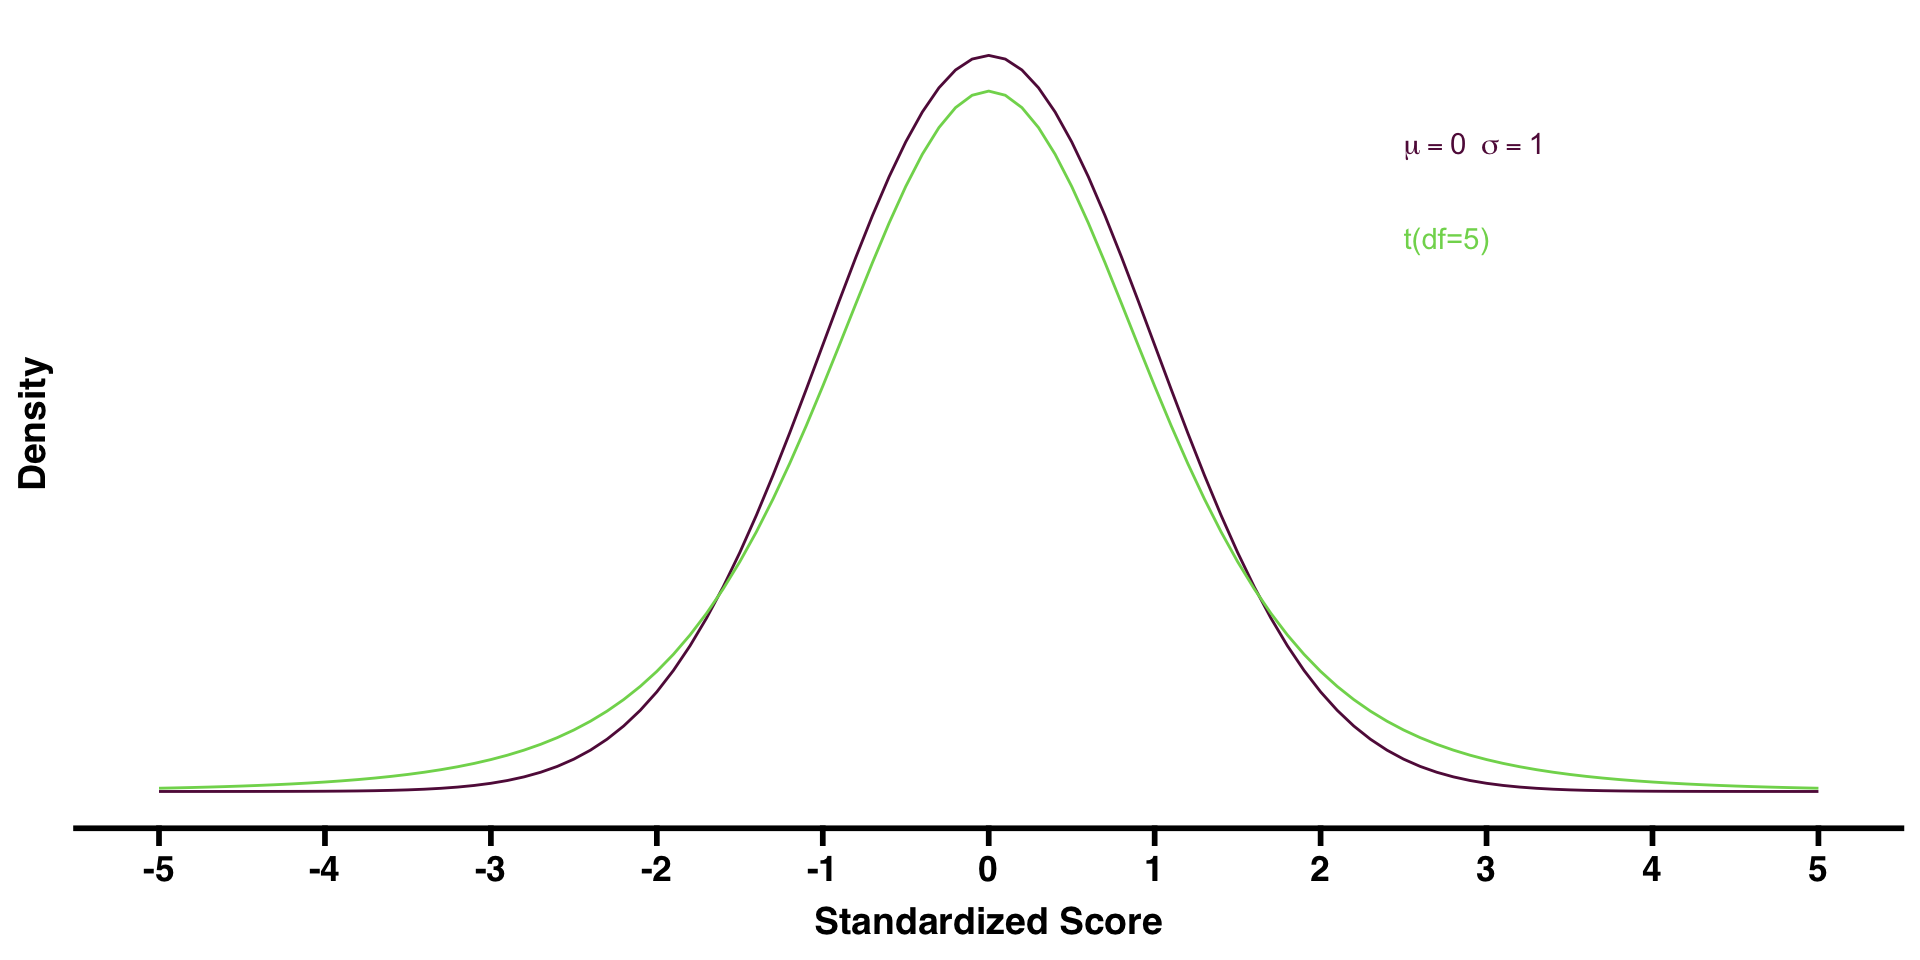
t-Distribution
- The mathematical approximation for our sampling distribution when we don’t know the population standard deviation (\(\sigma\))
- t-distribution is very similar in shape to the normal distribution, but with slightly thicker tails
- t-distribution is always centered at 0
- Because we are looking for an estimate for the variability in our sample we will be able to calculate that to be
\[ SE = \frac{s}{\sqrt{n}} \]
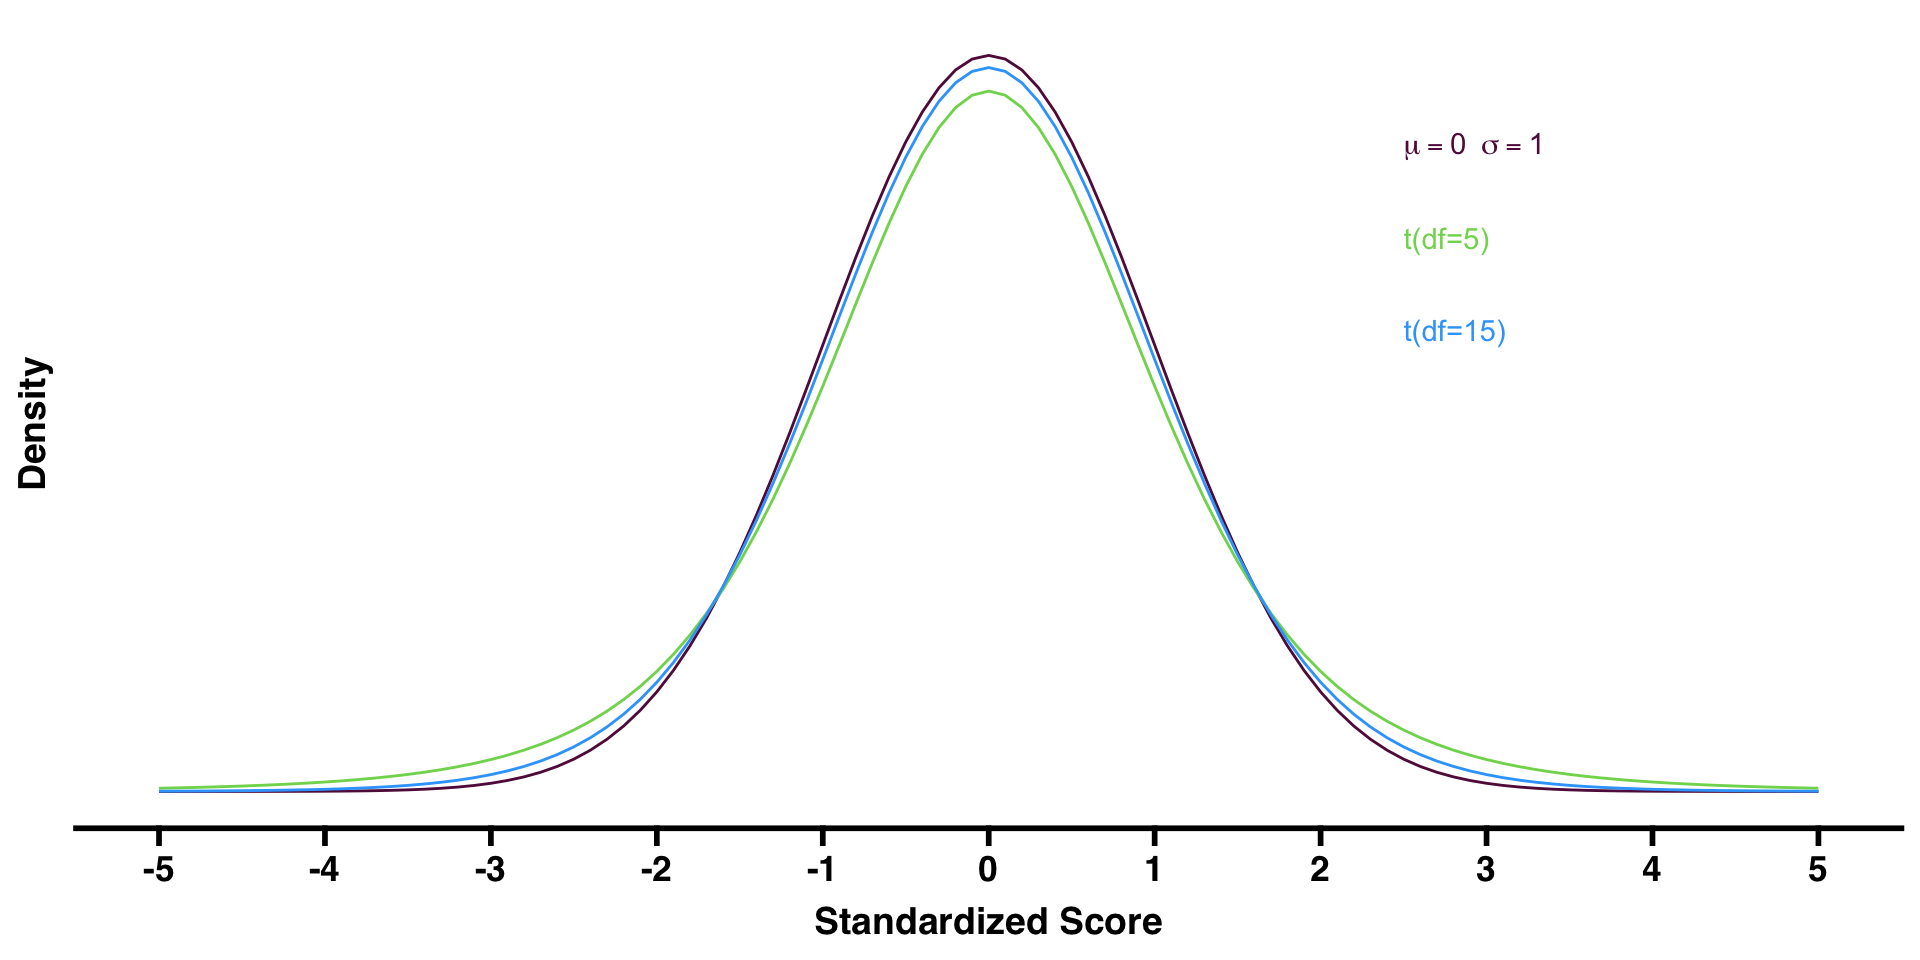
Degrees-of-Freedom
- The t-distribution is characterized by degrees-of-freedom (df)
- df is calculated based on sample size
- The higher the df, the closer the t-distribution gets to the normal distribution
t-Distributions
Assumptions
- The distribution of values in the population is normally distributed
- We will check a histogram or density plot of our sample to confirm this
- Note: If the sample size is greater than 30 we can use the t-distribution without our sample being normally distributed (because of the Central Limit Theorem)
- The values in the population are independent from each other
- We will think about this one based on the context
Use R Studio
- Instead of doing a simulation we can use the t-distribution to help us get our estimate for the variability in the sampling distribution
- Use functions in R Studio to also give us our p-value
- We will explore the entire hypothesis test process in today’s activity!
Hypothesis Testing with the t-Distribution Activity
Summary
- There are many steps to the hypothesis test (overview on Slide 9).
- Hypothesis tests help us test a claim while taking into account sampling variability.
- They provide one form of evidence to help answer a research question.
- We can use a t-distribution to help us conduct our test as an alternative method to simulation.