Day 15
Hypothesis Testing for Comparing Two Proportions


EPSY 5261 : Introductory Statistical Methods

Learning Goals

At the end of this lesson, you should be able to …

  • Describe the purpose of a hypothesis test for comparing groups.
  • List the steps of a hypothesis test.
  • Describe a parametric approach to hypothesis testing for comparing two proportions.
  • List the assumptions for using the z-distribution to test for a difference in proportions.

Recall: Attribute Types

  • When working with categorical data, the population proportion (\(\pi\)) has been our parameter of interest.
  • Sometimes we have two groups (categorical variable) that we want to compare the proportion between.
    • The parameter of interest is now \(\pi_{\text{Group 1}}-\pi_{\text{Group 2}}\).

Purpose of Hypothesis Testing

To test a claim about a population parameter

  • One Group
    • RQ: Is the proportion of people who vote Democrat different than 0.5?
  • Two Groups
    • RQ: Is there a difference in the proportion of people that vote democrat between those that live in rural and urban areas?

Steps of Hypothesis Testing

  1. Formulate a research question
  2. Write your hypotheses
  3. Find sampling distribution assuming the null hypothesis is true
  4. Compare sample summary to the distribution under the null hypothesis
  5. Get a p-value
  6. Make a decision based on the p-value
  7. Communicate your conclusion in context

Theoretical Distribution

  • z-distribution
    • Same as for a single proportion
  • This time we will compare the sample difference in proportions to the z-distribution

Assumptions

  • There are only two values the attribute can take on for each group (e.g., “yes” or “no”)
  • The values in both populations are independent from each other. (This is the case if we have a random sample.)
  • Sample size in both groups is large enough:
    • \(n_1(\hat{p_1}) > 10\)
    • \(n_1(1-\hat{p_1}) > 10\)
    • \(n_2(\hat{p_2}) > 10\)
    • \(n_2(1-\hat{p_2}) > 10\)

Research Question

Is there a difference the success rate of a new drug to cure a disease compared to a placebo?

Data

Treatment Success
Placebo yes
Drug yes
Drug no

Statistical Hypotheses

  • Null hypothesis: There is no difference in the success rate of a new drug to cure a disease compared to a placebo.
  • Alternative hypothesis: There is a difference in the success rate of a new drug to cure a disease compared to a placebo.

\[ {\begin{split} H_0: \pi_{\text{Drug}} &= \pi_{\text{Placebo}}\\ H_A: \pi_{\text{Drug}} &\neq \pi_{\text{Placebo}} \end{split} } \quad \text{OR} \quad {\begin{split} H_0: \pi_{\text{Drug}} - \pi_{\text{Placebo}} &= 0\\ H_A: \pi_{\text{Drug}} - \pi_{\text{Placebo}} &\neq 0 \end{split} } \]

Sample Statistics

Get the sample proportion of success:

df_stats(~Success | Treatment, data = trial, "props")
  response Treatment   prop_no  prop_yes
1  Success   Placebo 0.8387097 0.1612903
2  Success Treatment 0.6000000 0.4000000


Get the sample sizes:

df_stats(~Success | Treatment, data = trial, "counts")
  response Treatment n_no n_yes
1  Success   Placebo   26     5
2  Success Treatment   18    12

Sample Difference in Proportions → z-value

  • The sample statistic is the difference in proportions
    • We will subtract the proportion of success for the treatment group from the proportion of success for the placebo group (ALPHABETICALLY)
    • Sample difference in proportions: \(0.17 - 0.40 = -0.23\)
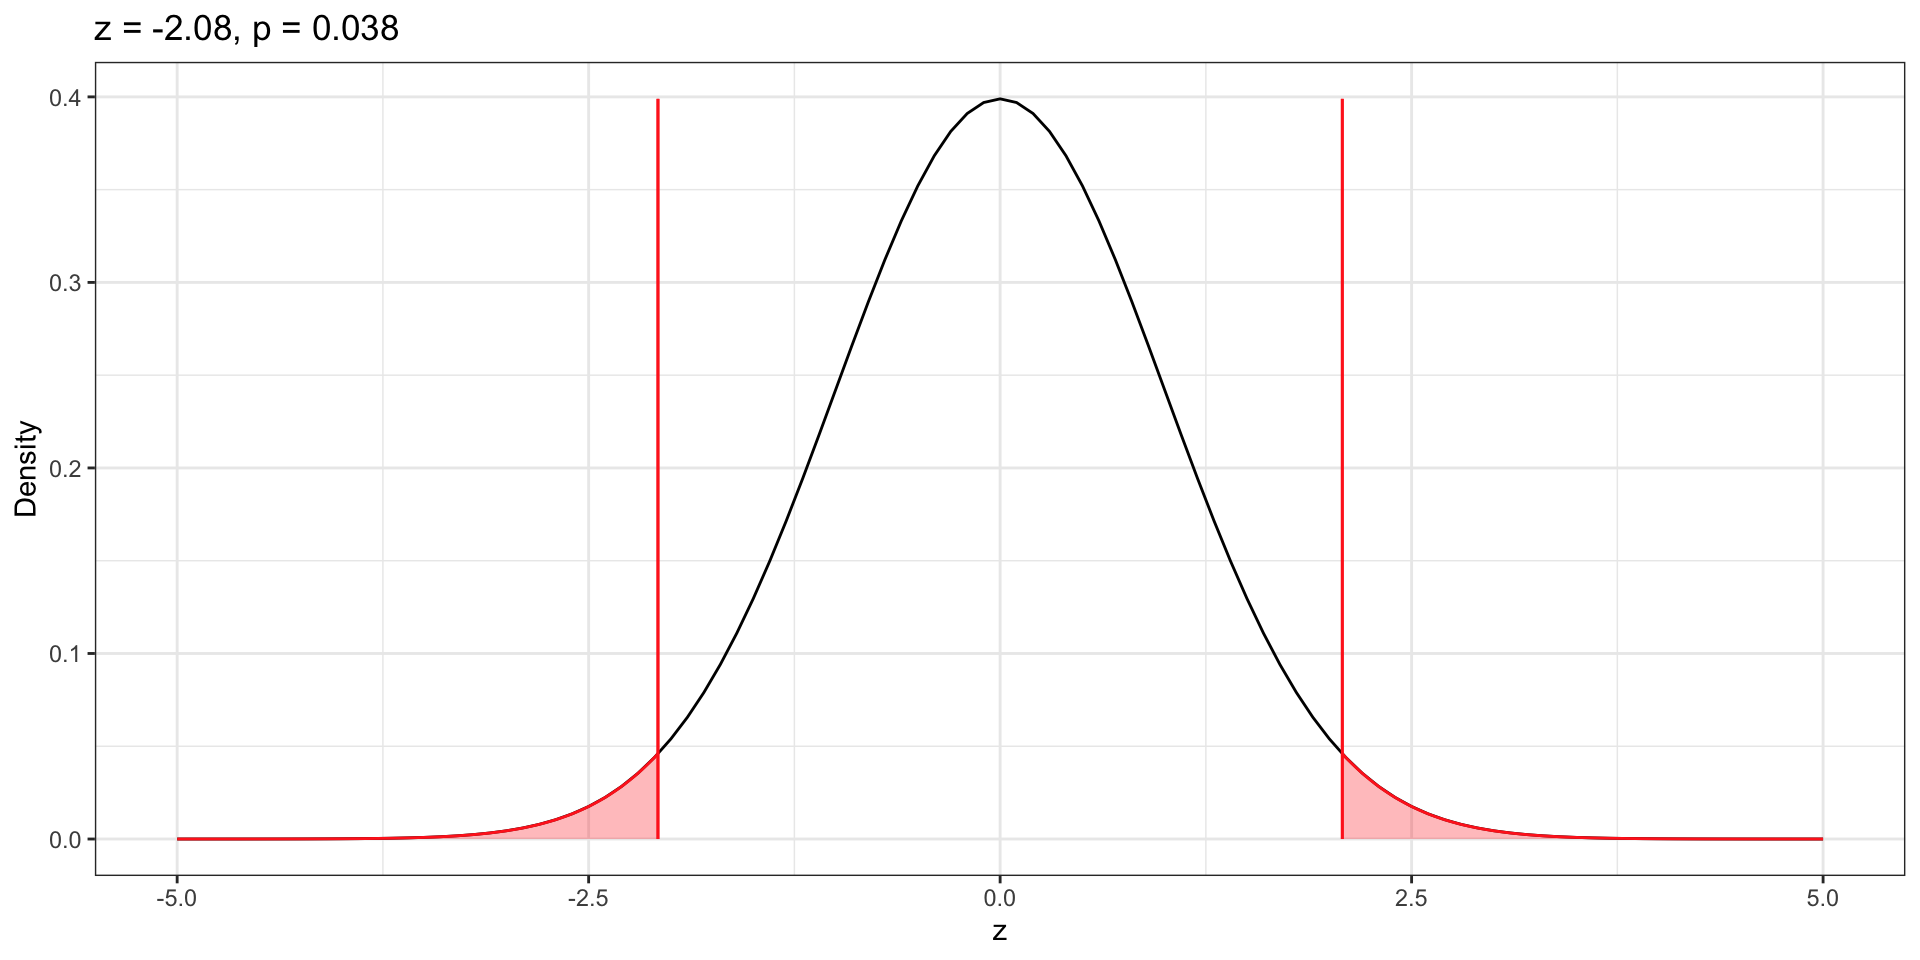
  • The sample difference of \(-0.23\) gets converted to a z-value: \(z = -2.08\) (R Studio will do this for us!)
  • This value gets evaluated in a z-distribution

R Studio

my_z <- prop_test(
  ~Success == "yes" | Treatment, 
  data = trial,
  alternative = "two.sided",
  correct = FALSE
) 

Compare Sample Difference to Null Distribution

plot_z_dist(my_z)

p-Value and Decision

Since our p-value is less than 0.05 here…we will reject the null hypothesis.

z_results(my_z)

--------------------------------------------------
2-sample test for equality of proportions without continuity correction
--------------------------------------------------

H[0]: pi_1 = pi_2
H[A]: pi_1 ≠ p1_2
z = -2.078862
p = 0.03763005

--------------------------------------------------

Conclusion

We can conclude that there is likely a difference between the success rate of the new drug compared to the placebo.

Hypothesis Testing for Comparing Two Proportions Activity

Summary

  • Hypothesis tests help us test a claim while taking into account sampling variability.
  • They provide one form of evidence to help answer a research question.
  • We can use a z-distribution to help us conduct our test when we have two groups to compare on a categorical attribute.