Day 17
Introduction to Confidence Intervals
EPSY 5261 : Introductory Statistical Methods
Learning Goals
At the end of this lesson, you should be able to …
- Identify when to answer a research question with a confidence interval.
- Explain the need for creating a confidence interval to do statistical inference.
- Know how to calculate a confidence interval by hand and using R Studio.
- Interpret a confidence interval.
Confidence Intervals
- We have uncertainty in our sample estimates because of sampling variability (i.e., samples vary)
- We need something to quantify the uncertainty in our estimates.
…
→ Confidence Intervals
Terminology
- Standard Deviation (SD): Average distance from the mean, where each case in the data is an individual value.
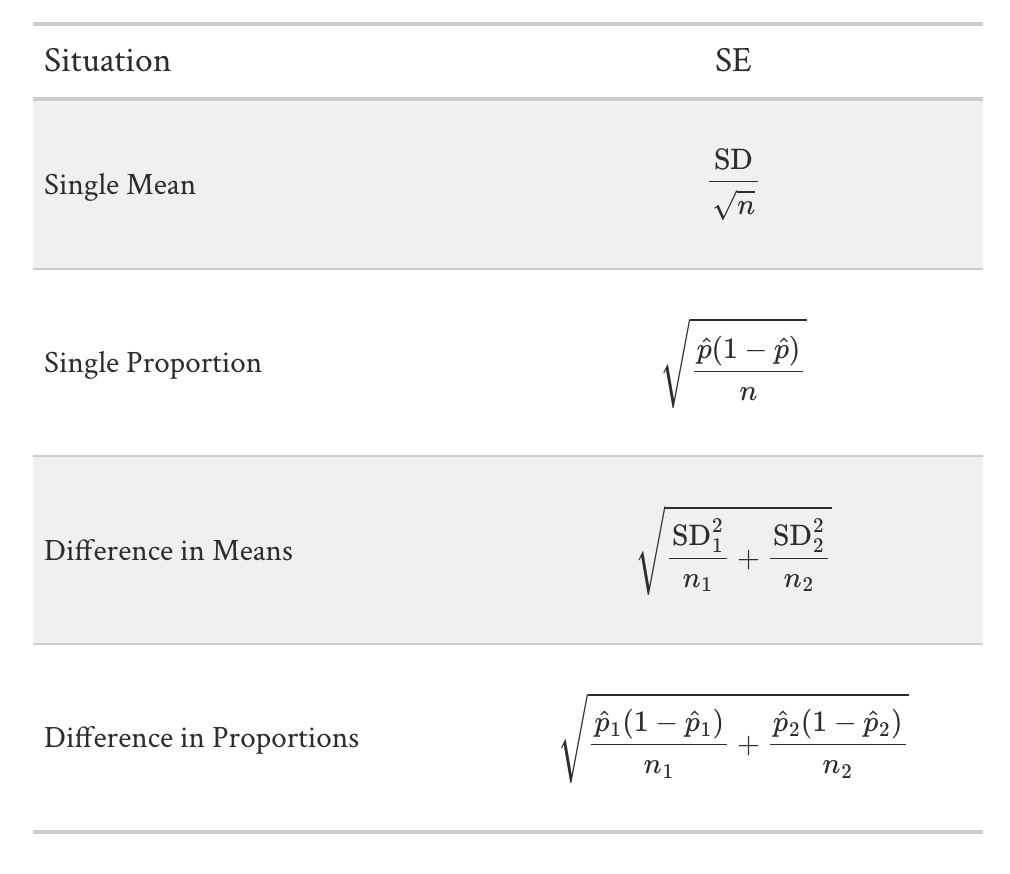
- Standard Error (SE): Standard deviation for a sampling distribution (where each case in the sampling distribution is a statistic).
Terminology (cntd.)
- 95% Confidence Interval
\[ 95\%~\text{CI} = \text{Sample Statistic} \pm \underbrace{(2 \times SE)}_{\text{Margin of Error}} \] - To get a confidence interval, we add and subtract a specified number of standard errors from the sample statistic. - Margin of error quantifies the amount of uncertainty (sampling error due to variation from sample-to-sample).
Table 19.1 in Textbook
Interpretation
- When interpreting a CI you need to include:
- Confidence level
- Population parameter
- Interval Estimate
Example: We are 95% confident that the average price of a single-family house near the University of Minnesota is between $348K and $461K.
Introduction to Confidence Intervals Activity
Examine the Intervals on the Board…
What do you notice?
Summary
- For a research question asking for an estimate, the best way to answer is with a confidence interval.
- The confidence interval allows us to account for uncertainty by including sampling variability in our estimate of the parameter.