Day 23
Introduction to Correlation
EPSY 5261 : Introductory Statistical Methods
Learning Goals
At the end of this lesson, you should be able to …
- Interpret scatterplots.
- Explain when to use correlation to explain a relationship between variables.
- Interpret a correlation.
Example
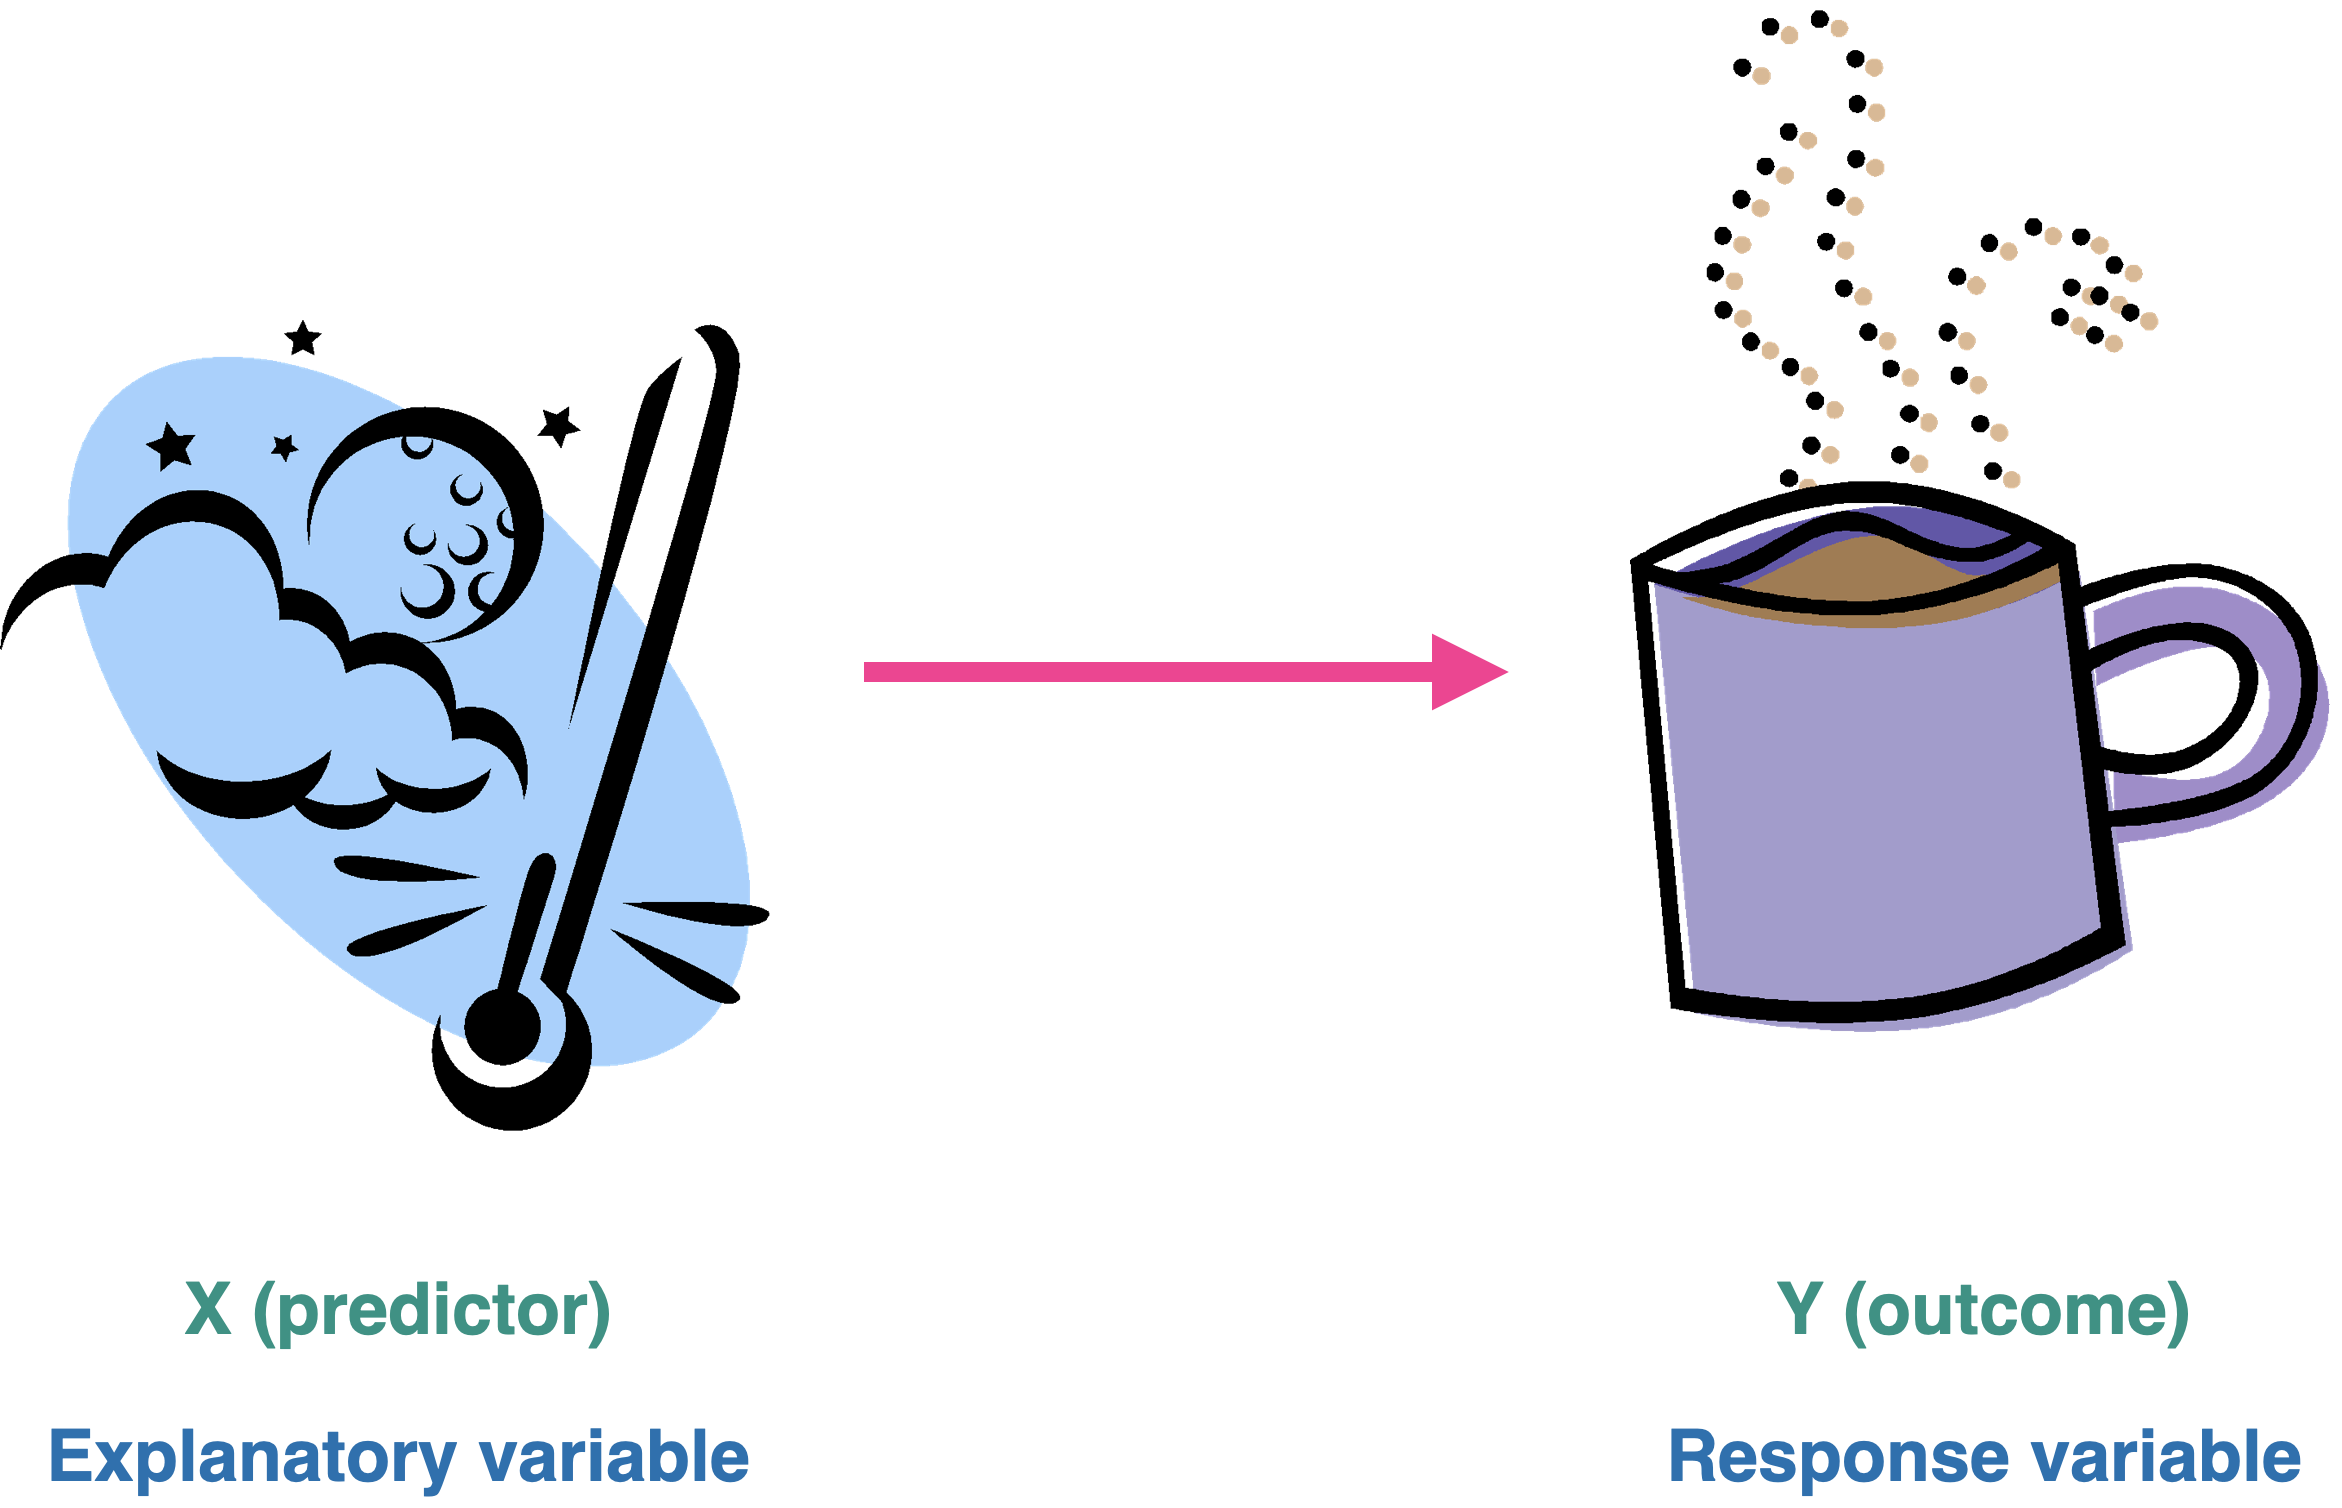
Say you want to use the temperature to predict coffee sales at an outdoor stadium
![]()
Scatterplot
- A plot of the relationship between two quantitative variables.
- Explanatory variable: The variable you want to use as a predictor (goes on x-axis)
- Response variable: The variable you want to predict (goes on y-axis)
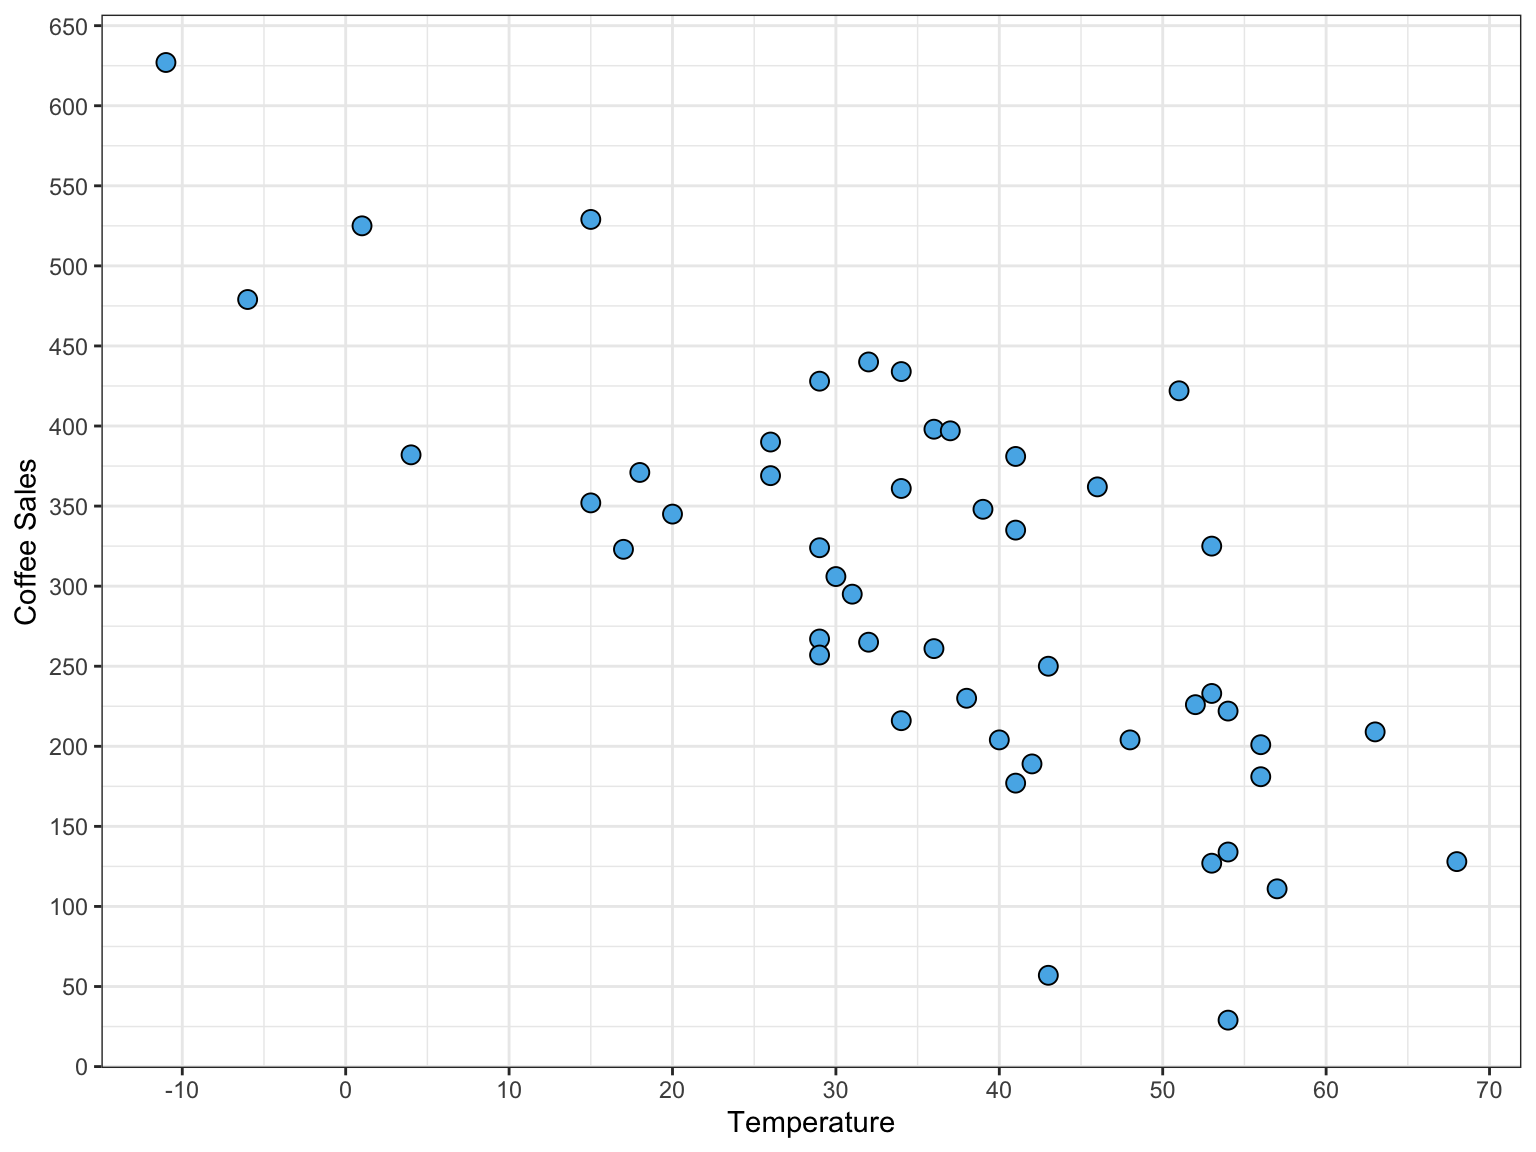
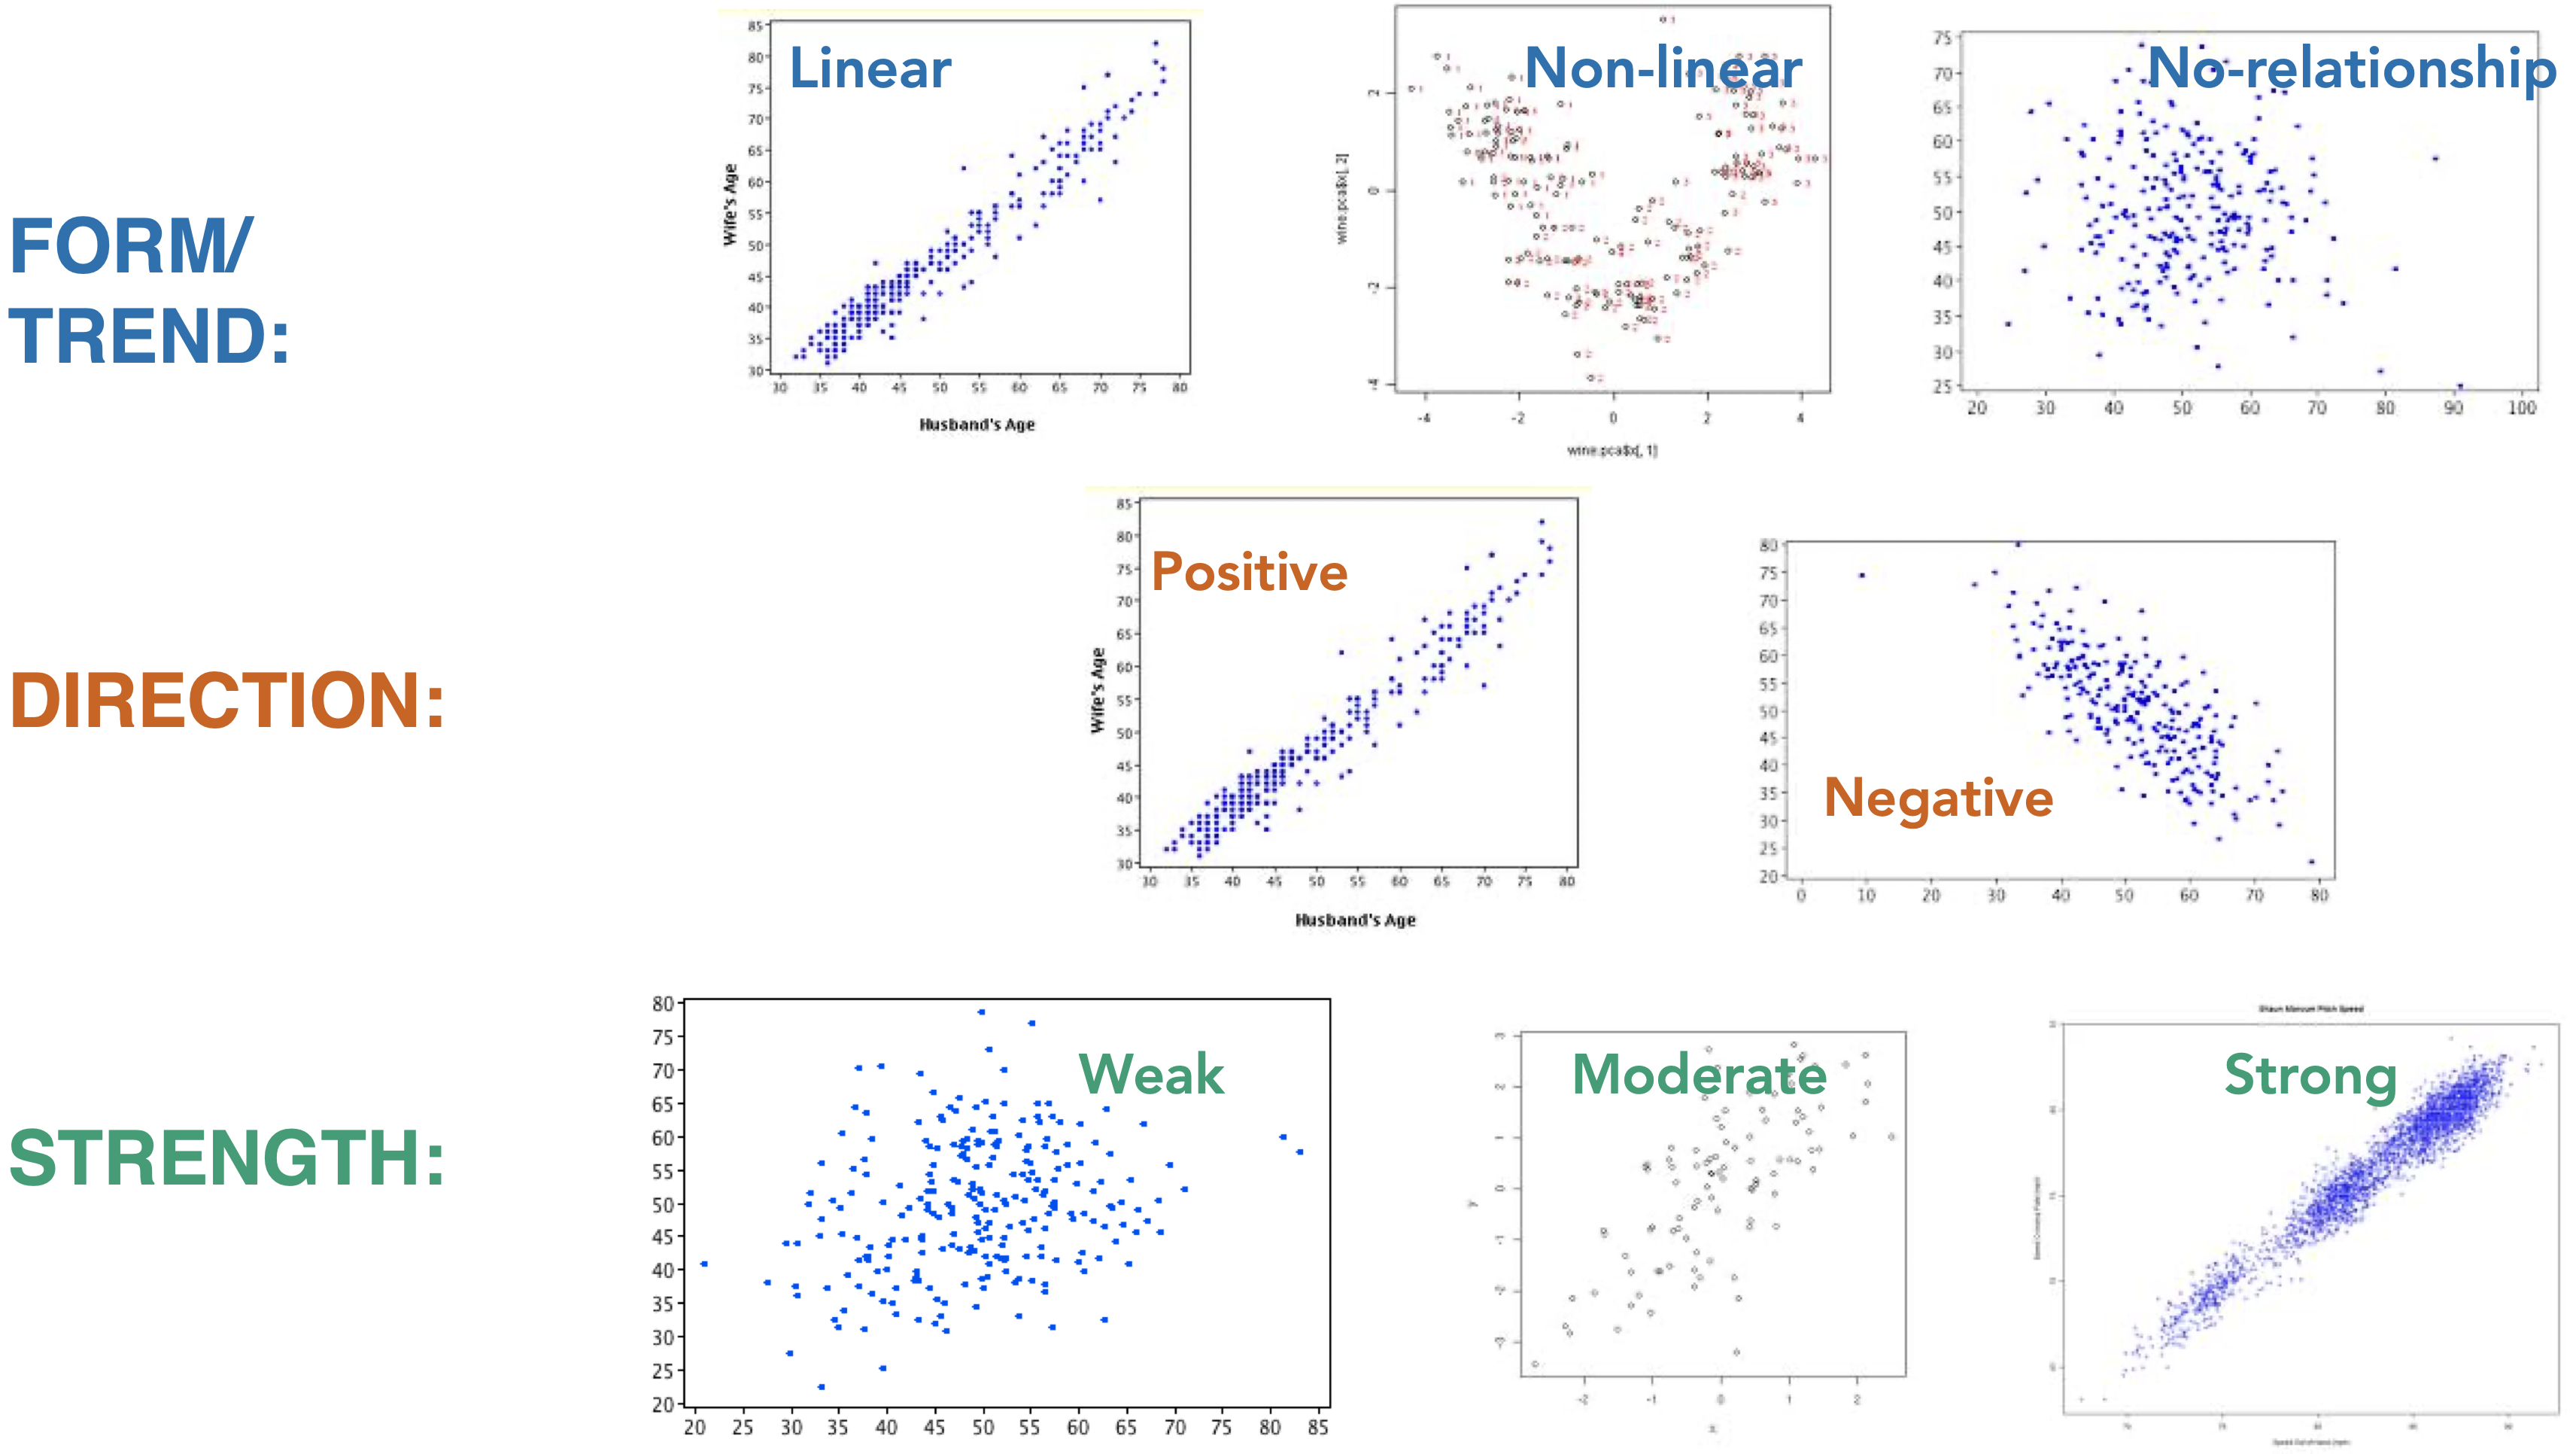
What pattern(s) do you see?
![]()
- Form/Trend?
- Direction?
- Strength?
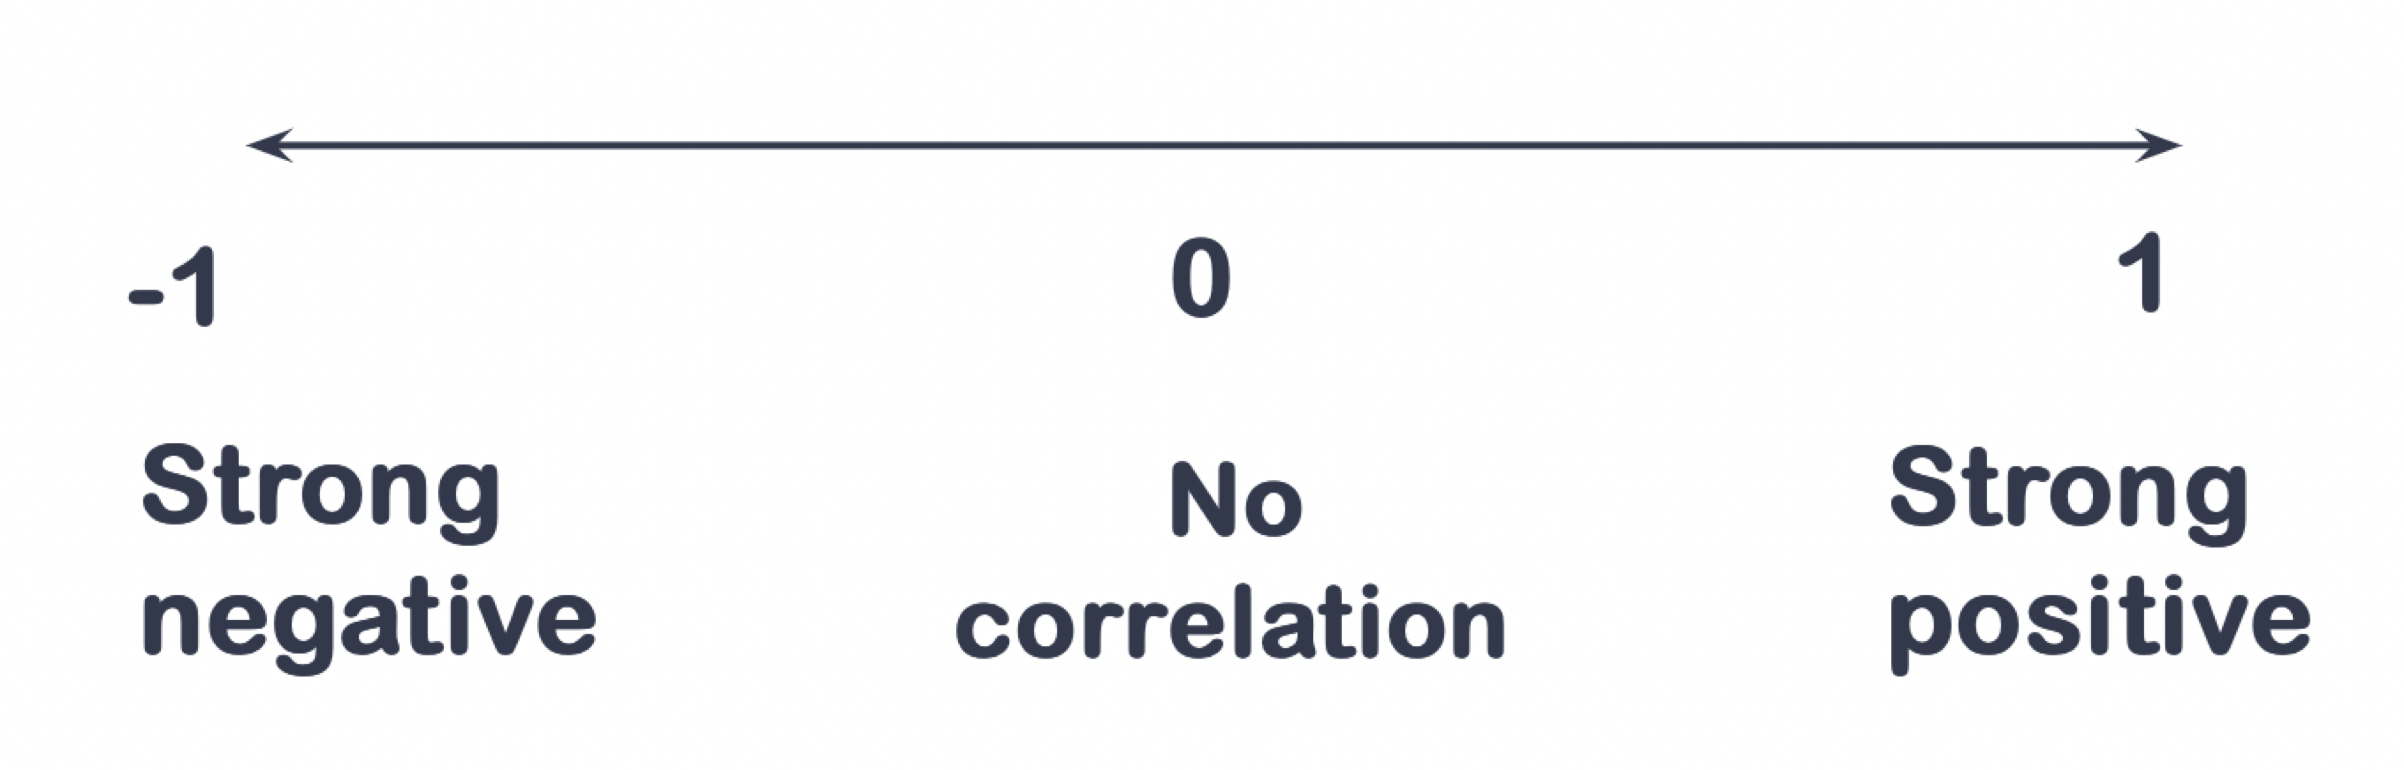
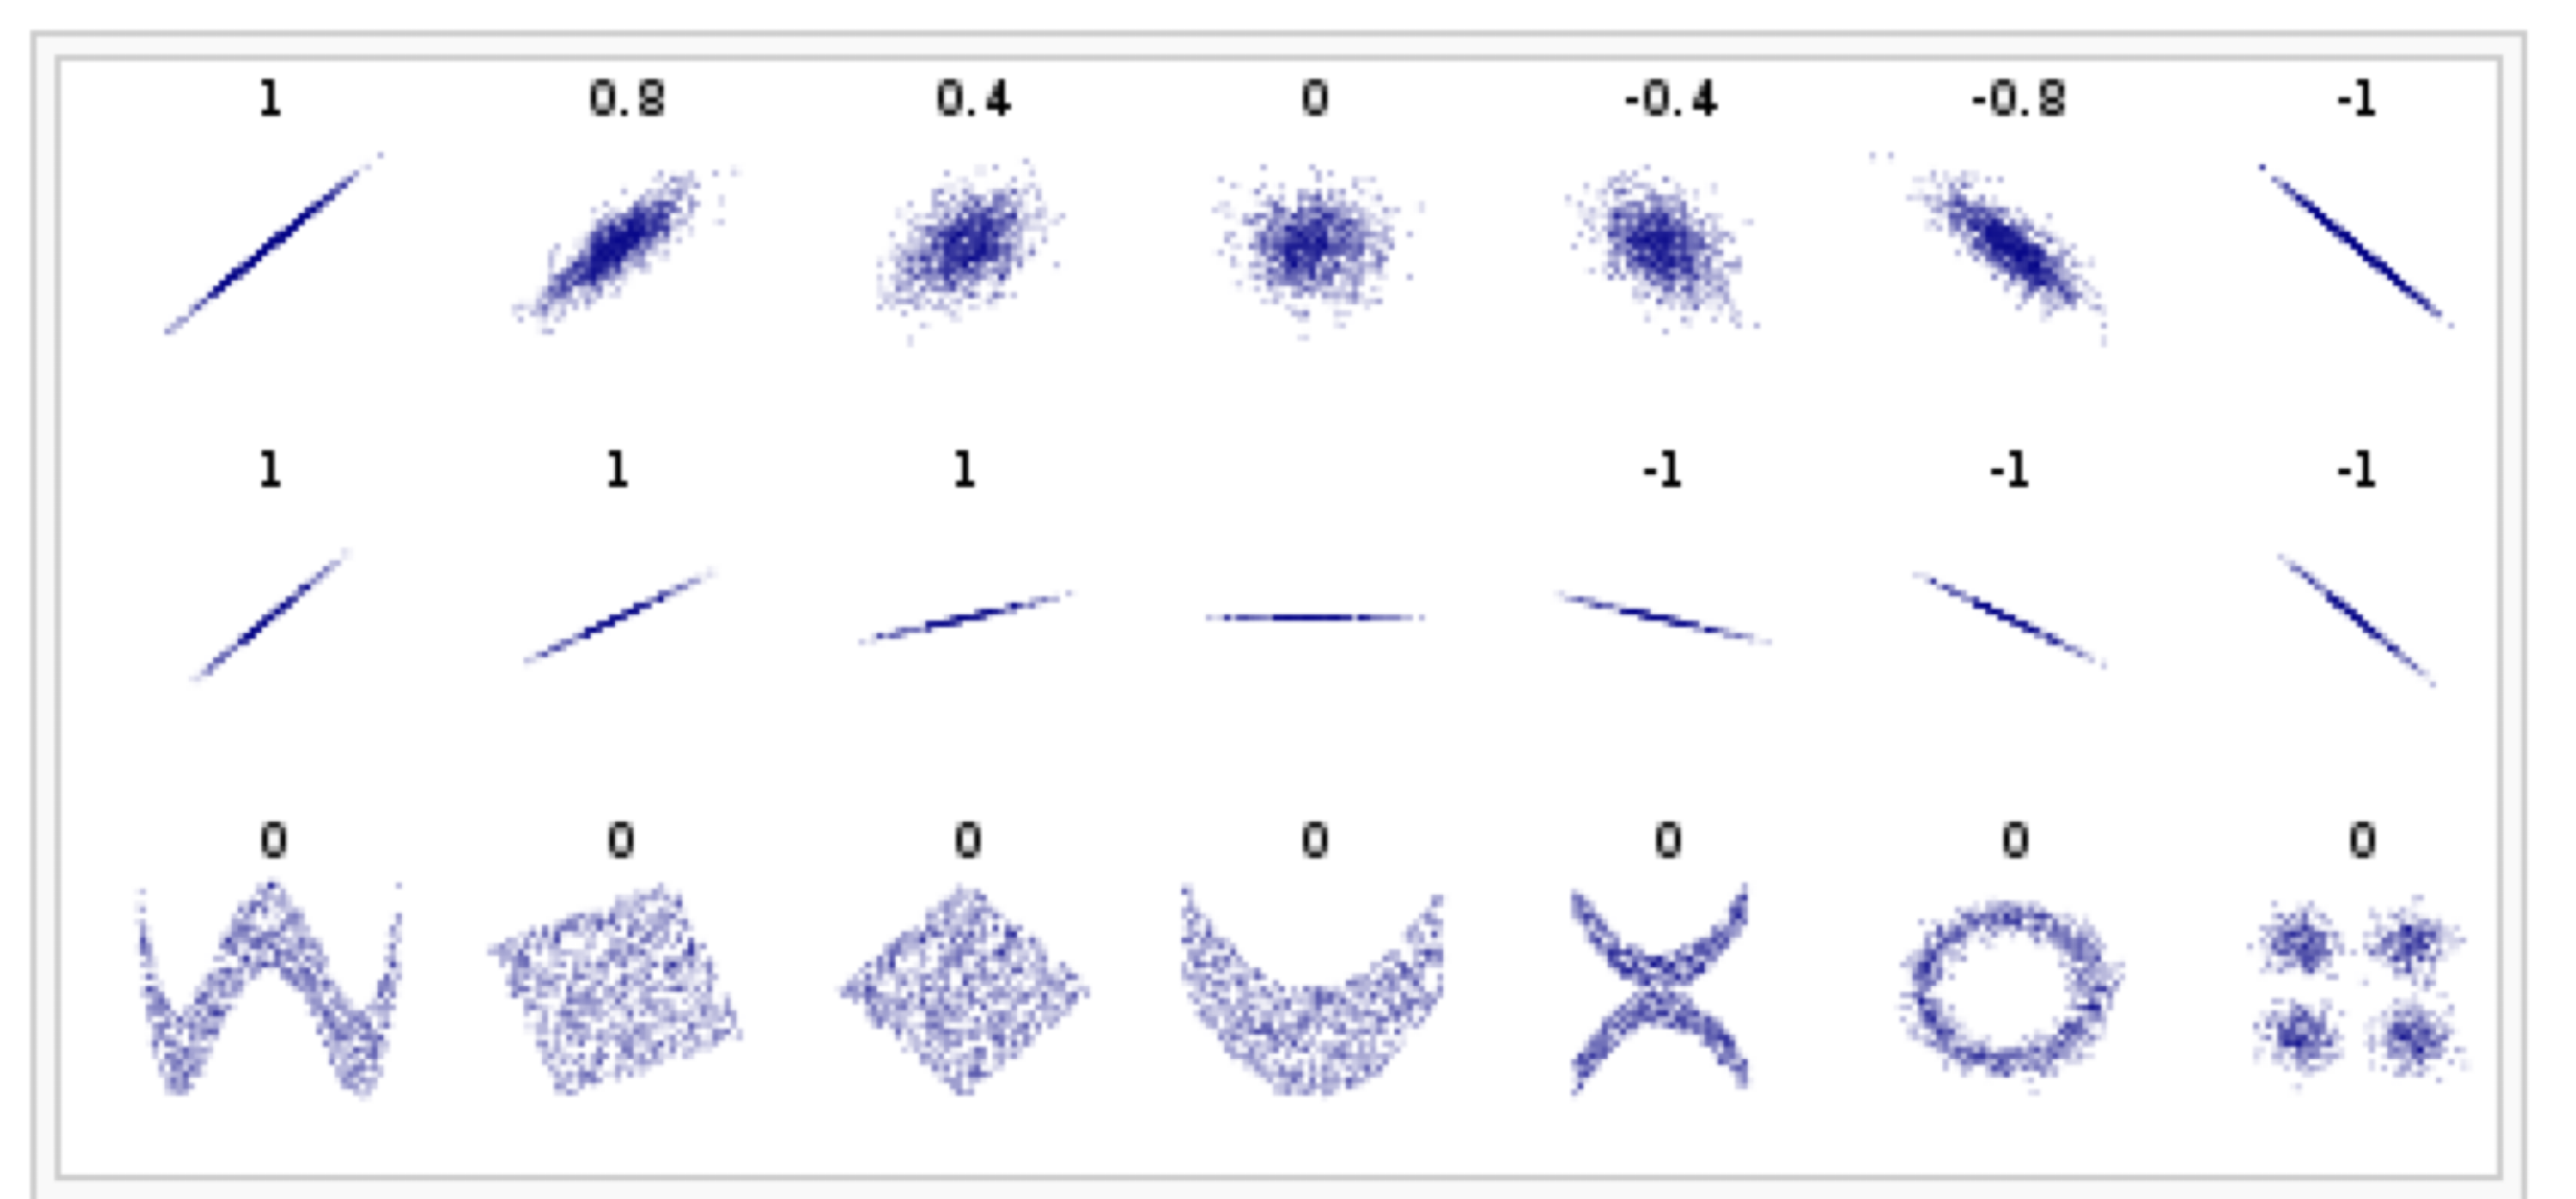
Correlation Coefficient (r)
- Quantifies the strength and direction of linear relationship
![]()
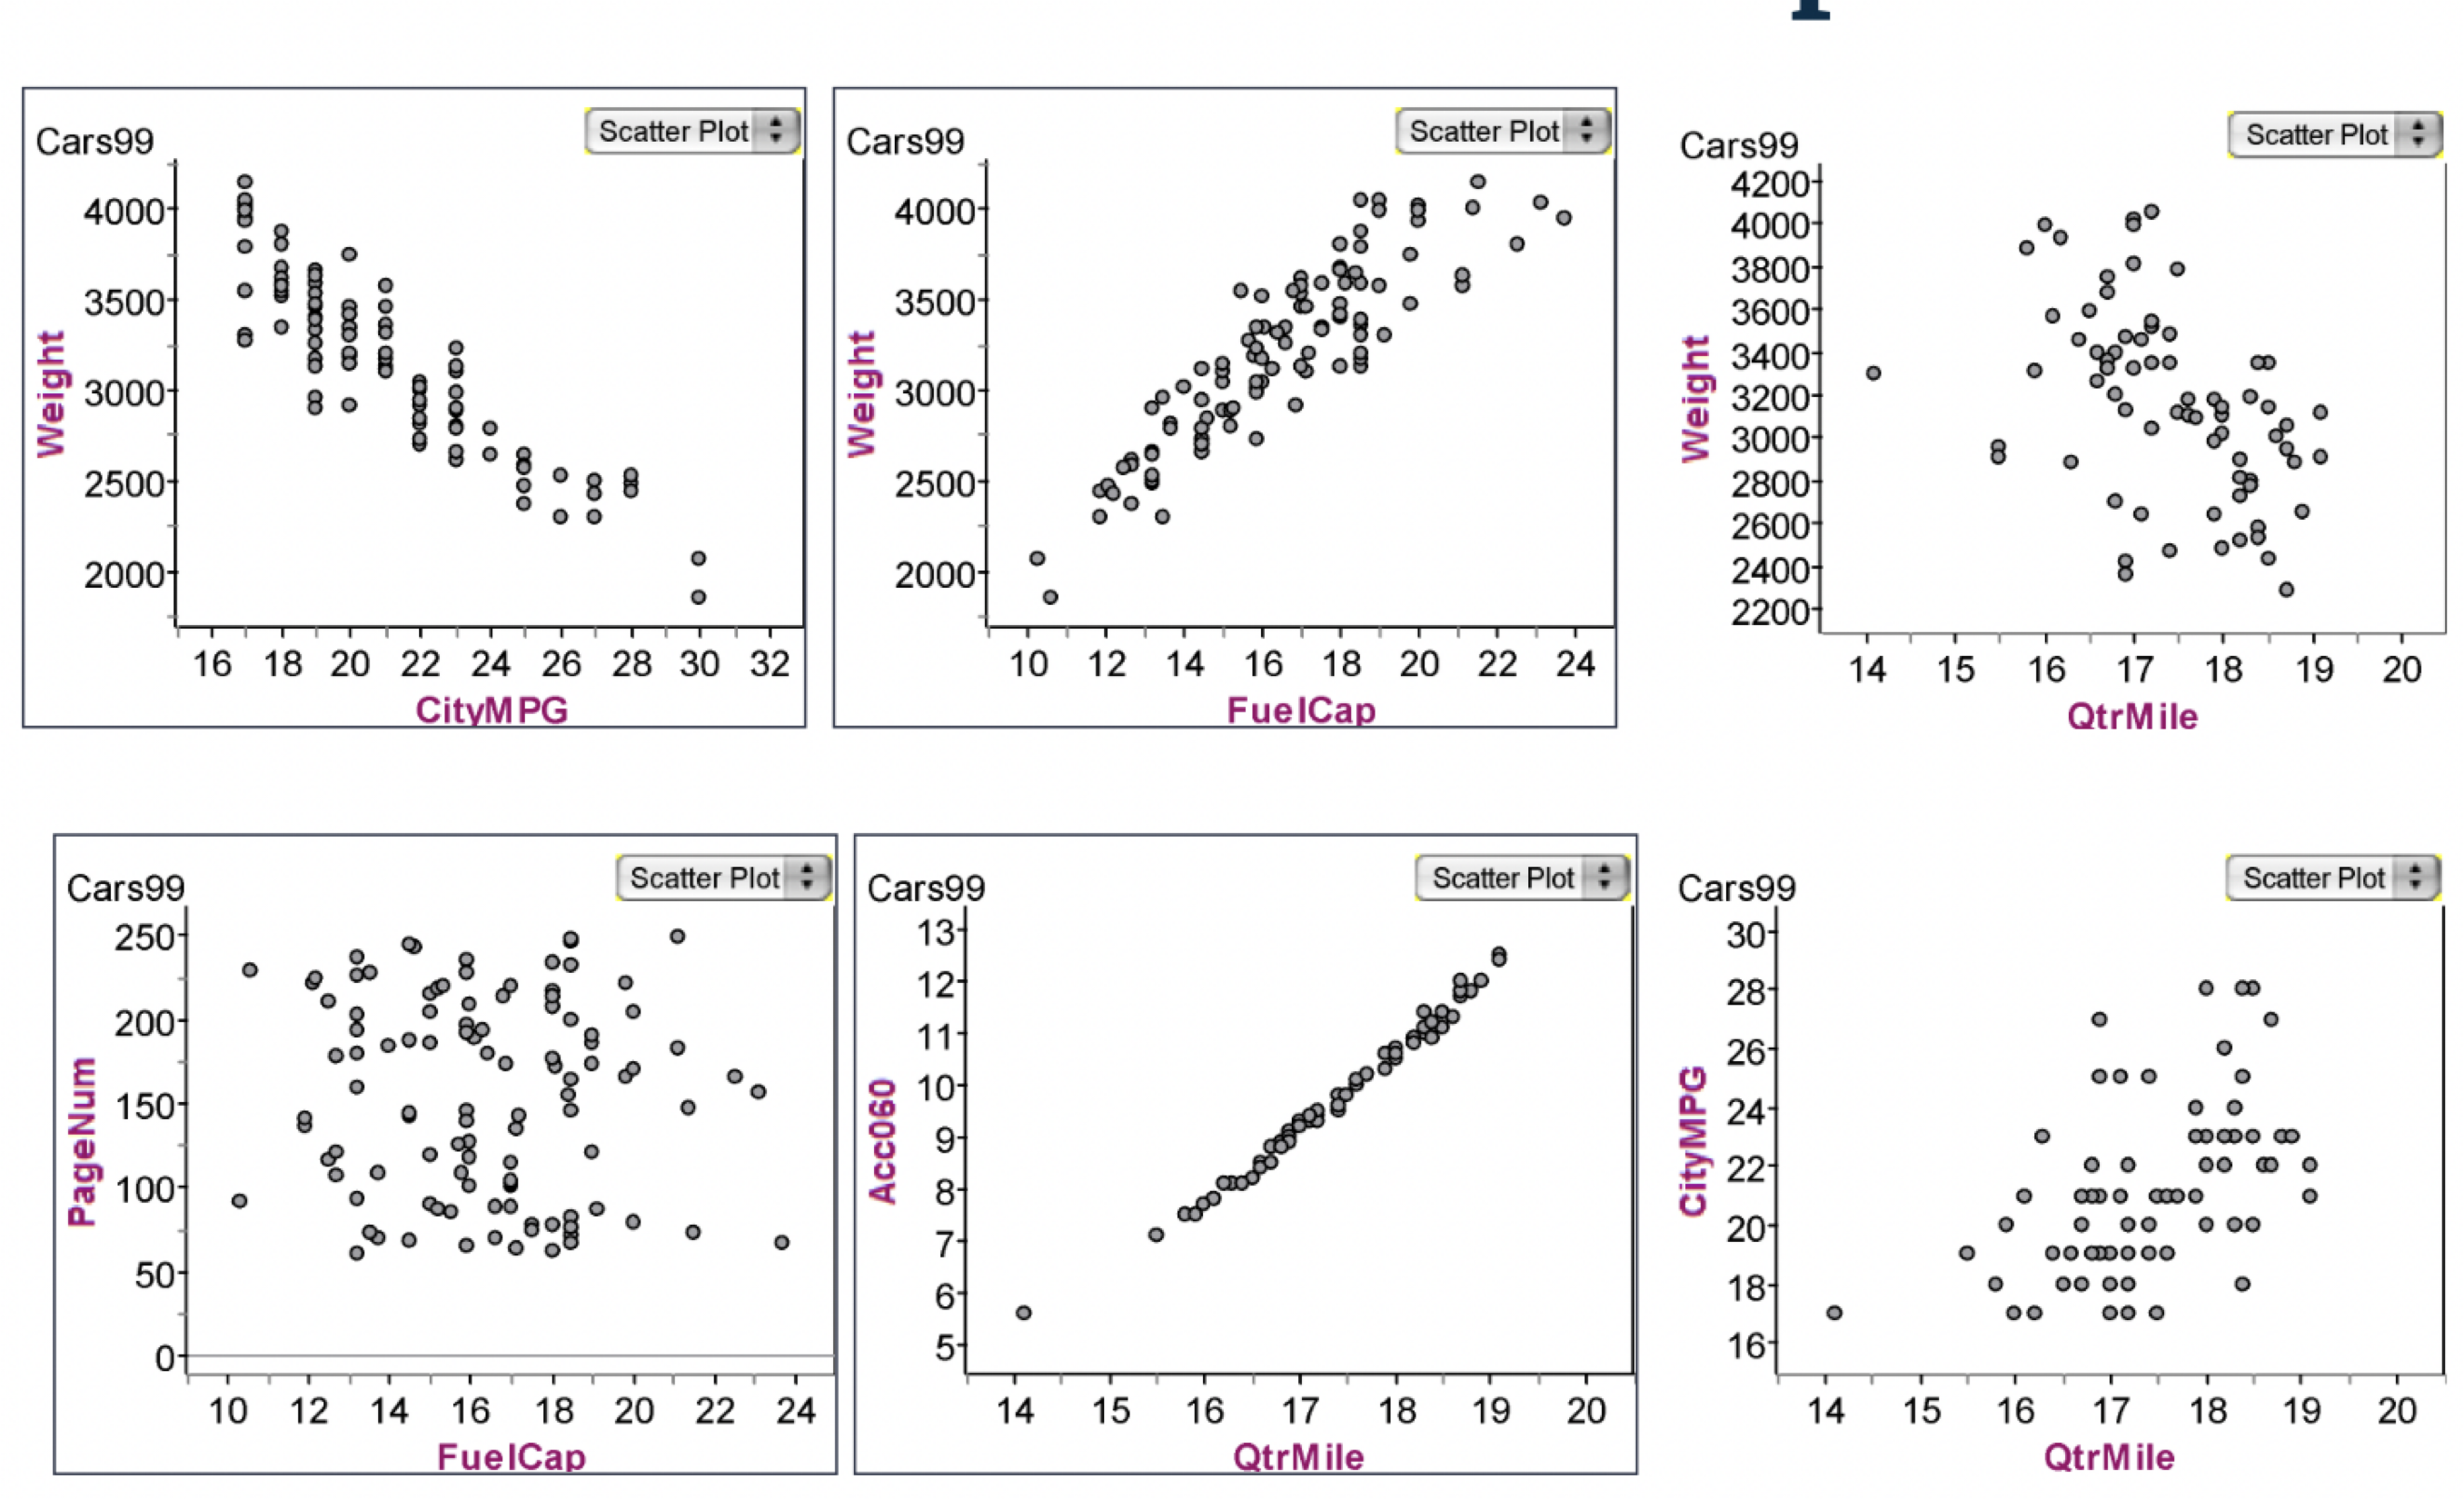
Car Correlation Example
![]()
Interpreting a Correlation
- Direction: Positive or negative?
- If positive: As X increases, Y tends to increase.
- If negative: As X increases, Y tends to decrease.
- How strong is the linear relationship?
- Weak (closer to 0)
- Moderate (somewhere in the middle — maybe \(\pm.4\) to \(\pm.7\))
- Strong (closer to \(\pm1\))
Always Plot Your Data
- You should always plot your data.
- Summaries don’t tell the whole story…
- All of these plots have the same mean and SD (for both X and Y) and the same correlation coefficient.
Back to Our Example
- Correlation between temperature and coffee sales is \(r=-0.741\).
- How would you interpret this correlation?
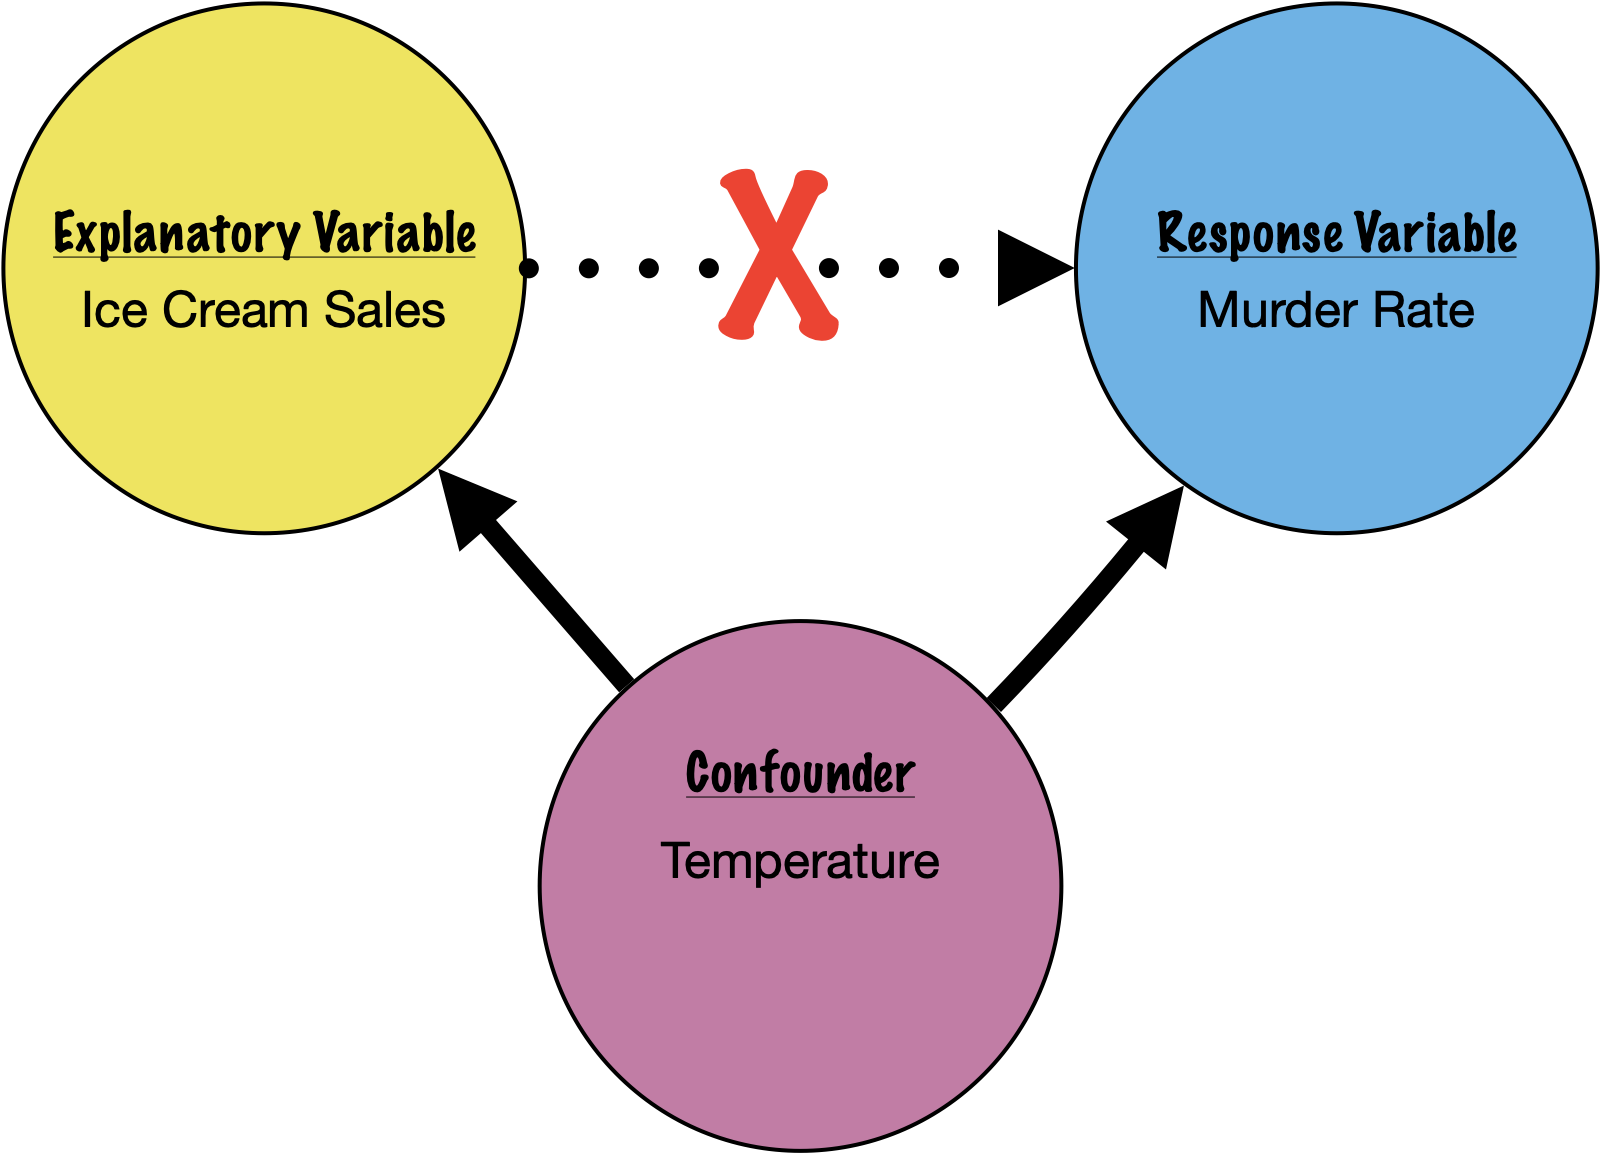
Correlation \(\neq\) CAUSATION!
There may be a confounding variable (a variable that impacts both the explanatory and response variables) that is explaining the relationship.
Other Fun Facts about Correlation
- Correlation between X and Y = Correlation between Y and X (symmetric).
- Correlation has no units.
- If units change (e.g., kg to lbs), correlation stays the same!
Introduction to Correlation Activity
Summary
- We can use a correlation to describe a linear relationship between two quantitative variables.
- A negative correlation implies a negative/indirect relationship.
- A positive correlation implies a positive/direct relationship.
- Correlation can only be between -1 and +1.
- Correlations close to -1 or +1 are strong.
- Correlations close to 0 are weak/non-existent.