Day 25
Hypothesis Test for a Slope
EPSY 5261 : Introductory Statistical Methods
Learning Goals
At the end of this lesson, you should be able to …
- Conduct a hypothesis test for a slope coefficient.
- Interpret results from a hypothesis test for a slope coefficient.
Recall: Linear Regression Equation
\[
\hat{y} = \underbrace{\beta_0}_{\text{Intercept}} + \underbrace{\beta_1}_{\text{Slope}}(x)
\]
![]()
t-Test for a Slope
- \(H_0: \beta_1=0\)
- The slope (in the population) equals 0. (i.e., There is no linear relationship between X and Y.)
- \(H_A: \beta_1\neq0\)
- The slope (in the population) does not equal 0. (i.e., There is a linear relationship between X and Y.)
Using R Studio
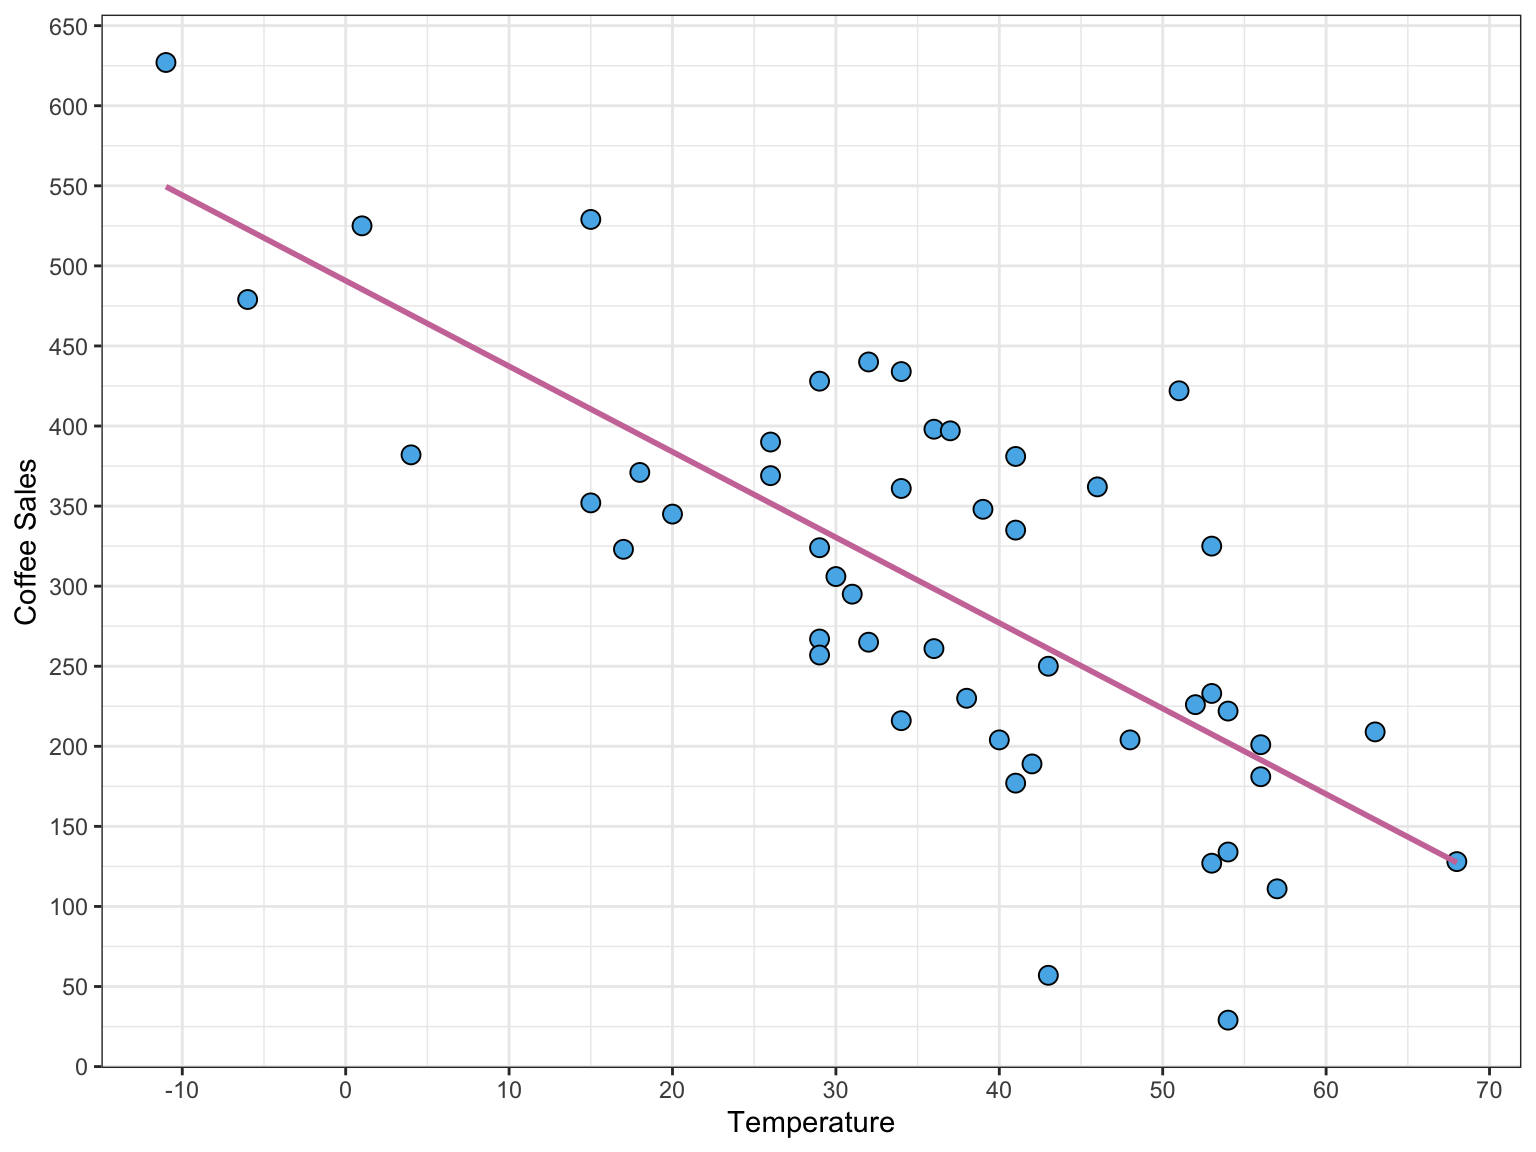
# Fit regression model
lm.a = lm(coffee_sales ~ 1 + temperature, data = coffee)
# See results of hypothesis test (Need broom package)
tidy(lm.a)
# A tibble: 2 × 5
  term        estimate std.error statistic  p.value
  <chr>          <dbl>     <dbl>     <dbl>    <dbl>
1 (Intercept)   491.      28.2       17.4  4.29e-22
2 temperature    -5.34     0.709     -7.54 1.26e- 9
Hypothesis Test for a Slope Activity
Summary
- If we want to determine if X is a statistically significant predictor of Y we can do a hypothesis test for the slope.
- A small p-value tells us that there is evidence the slope is different than 0 (i.e., X is a predictor of Y).