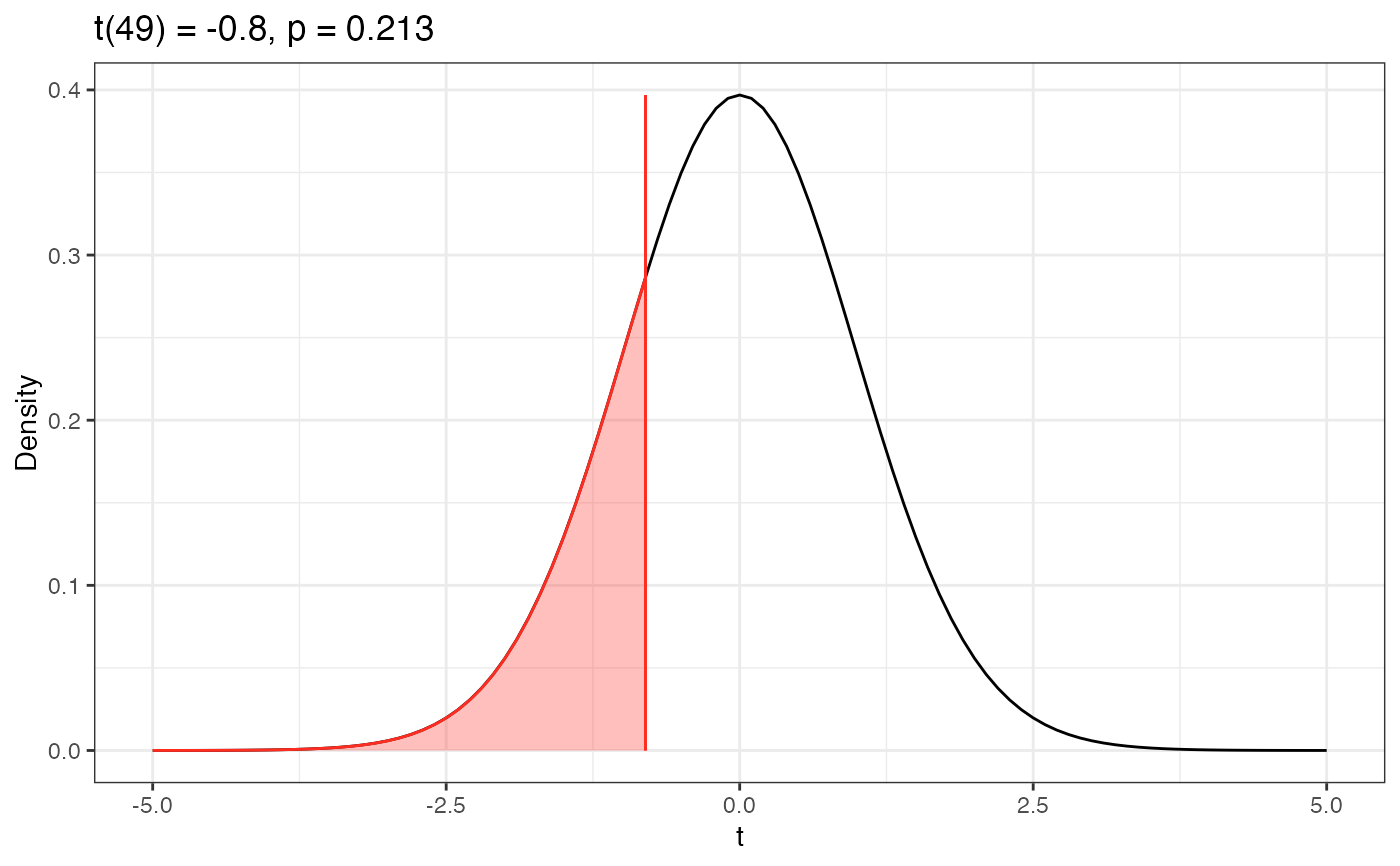
Plot t-Distribution and Shaded p-Value
plot_t_dist(x, shade_p_value = TRUE)Arguments
Value
Plot of the t-distribution. If shade_p_value=TRUE, the area under the curve corresponding to the p-value will also be shaded.
Examples
my_t = t.test(cars$speed, mu = 16, alternative = "less")
plot_t_dist(my_t)