Plot z-Distribution and Shaded p-Value
plot_z_dist(x, shade_p_value = TRUE)Arguments
Value
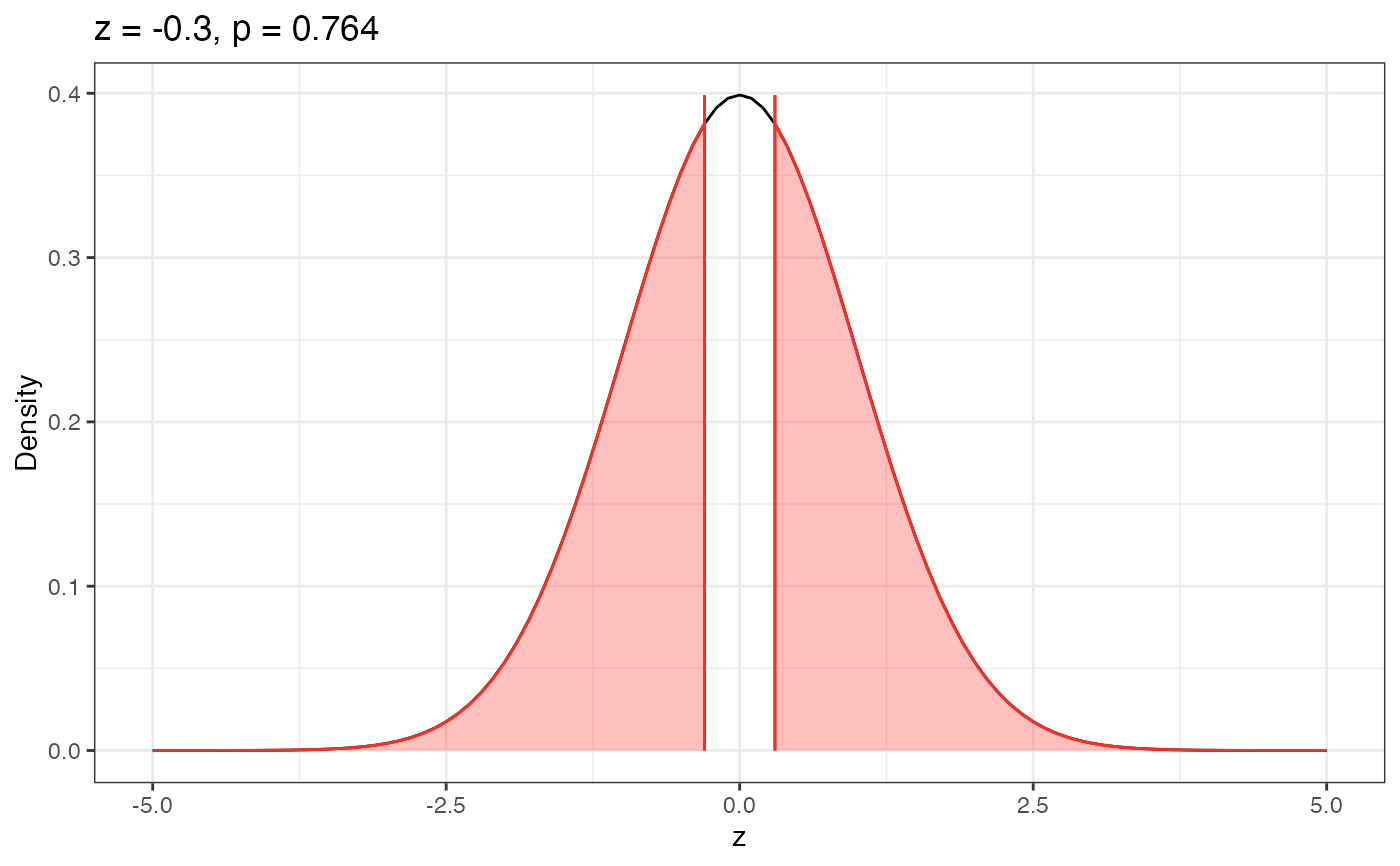
Plot of the z-distribution. If shade_p_value=TRUE, the area under the curve corresponding to the p-value will also be shaded.
Plot z-Distribution and Shaded p-Value
plot_z_dist(x, shade_p_value = TRUE)Plot of the z-distribution. If shade_p_value=TRUE, the area under the curve corresponding to the p-value will also be shaded.