Residual Plots for Linear Models
residual_plots(model, type = "b")Arguments
Value
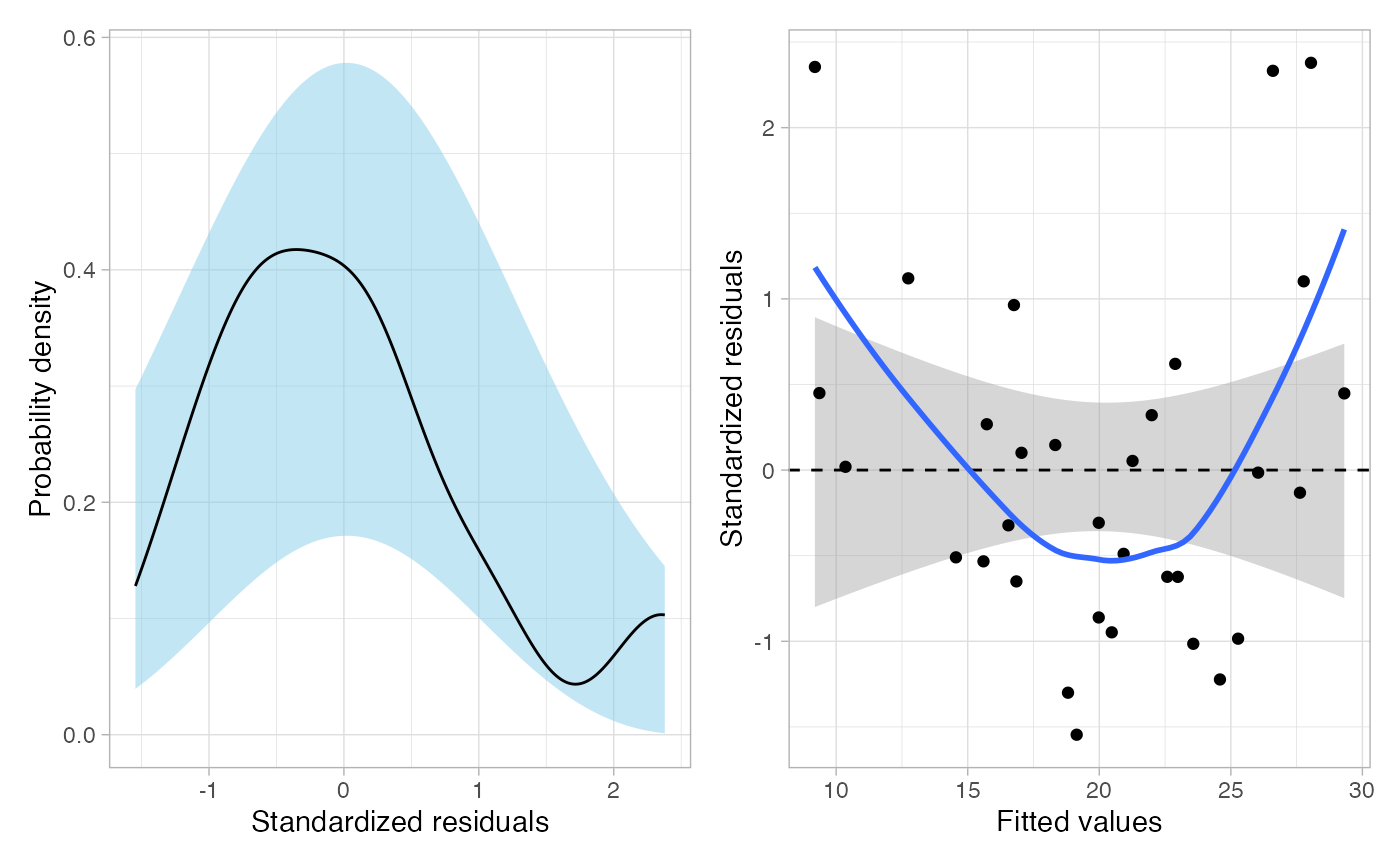
One or more plots of the standardized residuals. In the density plot, a confidence envelope of reasonable values based on the normality assumption being true is produced along with the empirical density of the residuals. In the scatterplot of the standardized residuals versus the fitted values, a confidence envelope of reasonable values based on the mean residual = 0 (linearity) is produced along with the loess smoother based on the empirical data.
Examples
lm.1 = lm(mpg ~ 1 + hp + wt, data = mtcars)
residual_plots(lm.1, type = "b")
#> `geom_smooth()` using formula = 'y ~ x'
#> `geom_smooth()` using formula = 'y ~ x'