Assignment 04
LOGARITHMIC TRANSFORMATIONS
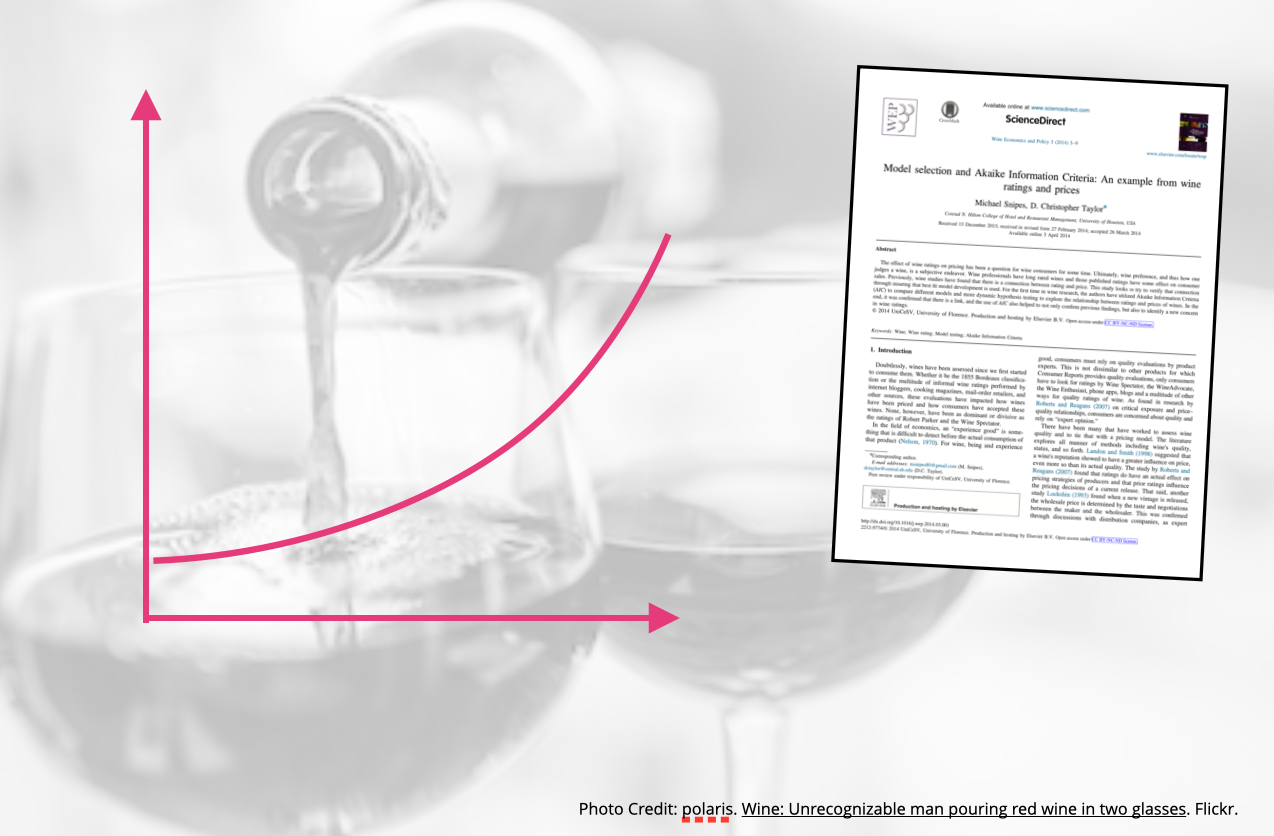
The goal of this assignment is to give you experience fitting, interpreting, and evaluating models with logarithmically transformed variables. In this assignment, you will use the data from the file wine.csv to examine several different predictors of wine rating (a measure of the wine’s quality). The literature has suggested that price of wine is quite predictive of a wine’s quality. You will be carrying out a replication study (using a different data set) of a study published by Snipes and Taylor (2014).
Instructions
Submit either your QMD and HTML file or, if you are not using Quarto, a PDF file of your responses to the following questions. Please adhere to the following guidelines for further formatting your assignment:
- All graphics should be resized so that they do not take up more room than necessary and should have an appropriate caption.
- Any typed mathematics (equations, matrices, vectors, etc.) should be appropriately typeset within the document using Markdown’s equation typesetting.
- All syntax should be hidden (i.e., not displayed) unless specifically asked for.
- Any messages or warnings produced (e.g., from loading packages) should also be hidden.
This assignment is worth 15 points.
Model 1: Effect of Wine Rating on Price
Create and examine the scatterplot of the relationship between wine rating (predictor) and price. Include the loess smoother in this plot. Does this plot suggest any nonlinearity in the relationship between wine rating and price that we need to address?
Regress the log-transformed price variable (using the natural logarithm) on wine rating (Model 1). Report and interpret the slope coefficient (using the log-metric) from the fitted model.
Report and interpret the back-transformed slope coefficient from Model 1.
Effect of Wine Rating and Region on Log-Transformed Price
Fit two additional models:
- A model that includes the effects of whether or not the wine is from California (i.e.,
california) to predict variation in the log-transformed price (Model 2). - A model that includes the effects of wine rating and whether or not the wine is from California (i.e.,
california) to predict variation in the log-transformed price (Model 3).
Interpret the effect associated with
californiapredictor (using the log-metric) from Model 3.Report and interpret the back-transformed coefficient associated with
californiapredictor from Model 3.
Fit a model that includes both the the wine rating and california main effects, as well as, the interaction effect between those predictors to predict variation in the log-transformed price (Model 4).
- Create a table to present the numerical information from the three models you fitted in this assignment along with the AICc values. (Mimic the Presenting Results from Many Fitted Regression Models section of the document Creating Tables to Present Statistical Results to create this table. Include the AICc value below the RMSE value in the table.) Make sure the table you create also has an appropriate caption. If the table is too wide, change the page orientation in your word processing program to “Landscape”, rather than changing the size of the font. (Note: Only this table should be presented in landscape orientation…not your entire assignment!) (3pts.)
Adopting a “Final” Candidate Model
Based on the model evidence, which of the candidate models will you adopt as your “final” model? Explain.
Write the fitted equation for the adopted candidate model.
Create and report a set of residual plots that allow you to evaluate the adopted model’s assumptions. Are the assumptions for the model satisfied? Explain. (2pts.)
Presenting the Results
Create a publication quality plot that displays the fitted curve(s) from your adopted candidate model. If you show more than one curve, each line should be easily differentiated in the plot. (Note: Make sure that you back-transform any log-transformed variables when you create this plot.) (2pts.)
Use the plot to help describe/interpret the effect of wine rating on price.