TinkerPlots 101: Generating Simulated Data
Social scientists are increasingly using simulation methods to help them understand the social processes they study. At the heart of simulation methods is using a model to generate random samples of simulated data. Most of the models you will encounter in this course are referred to as probability models. That is just a fancy way of associating probabilities with different events, or outcomes, in a model. For example, the model of flipping a “fair” coin is a probability model. There are two events/outcomes in the model: heads and tails. Each of these outcomes has a probability of 0.5 associated with it. (Note that although we could say 50%, that probabilities are on the scale from 0 to 1, so are defined using decimal values.) To generate simulated data using TinkerPlots, we use a sampler to specify characteristics of the model. The sampler is composed of one or more sampling devices that use a random process to generate data from the prespecified model.
Creating a Sampler
To create a sampler, you will:
- Click on the
Samplericon in the TinkerPlots toolbar and drag a sampler from into your workspace.
The default sampler is a mixer with three balls in it. The mixer is one of six different sampling devices we can use in our sampler. You can see the icons for other potential sampling devices at the bottom of the sampler.
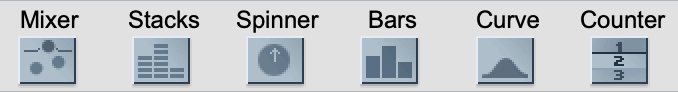
The three sampling devices we will use most often in this class are: spinners, mixers, and stacks. While all three of these devices are similar in that they generate data by randomly sampling from aset of discrete elements, they have some subtle diffeences that make some devices more appropriate in certain situations. To illustrate these differences, consider a situation in which you are randomly generating animals from a population that includes:
- Three goats
- Four cows
- Ten chickens
- One sheep
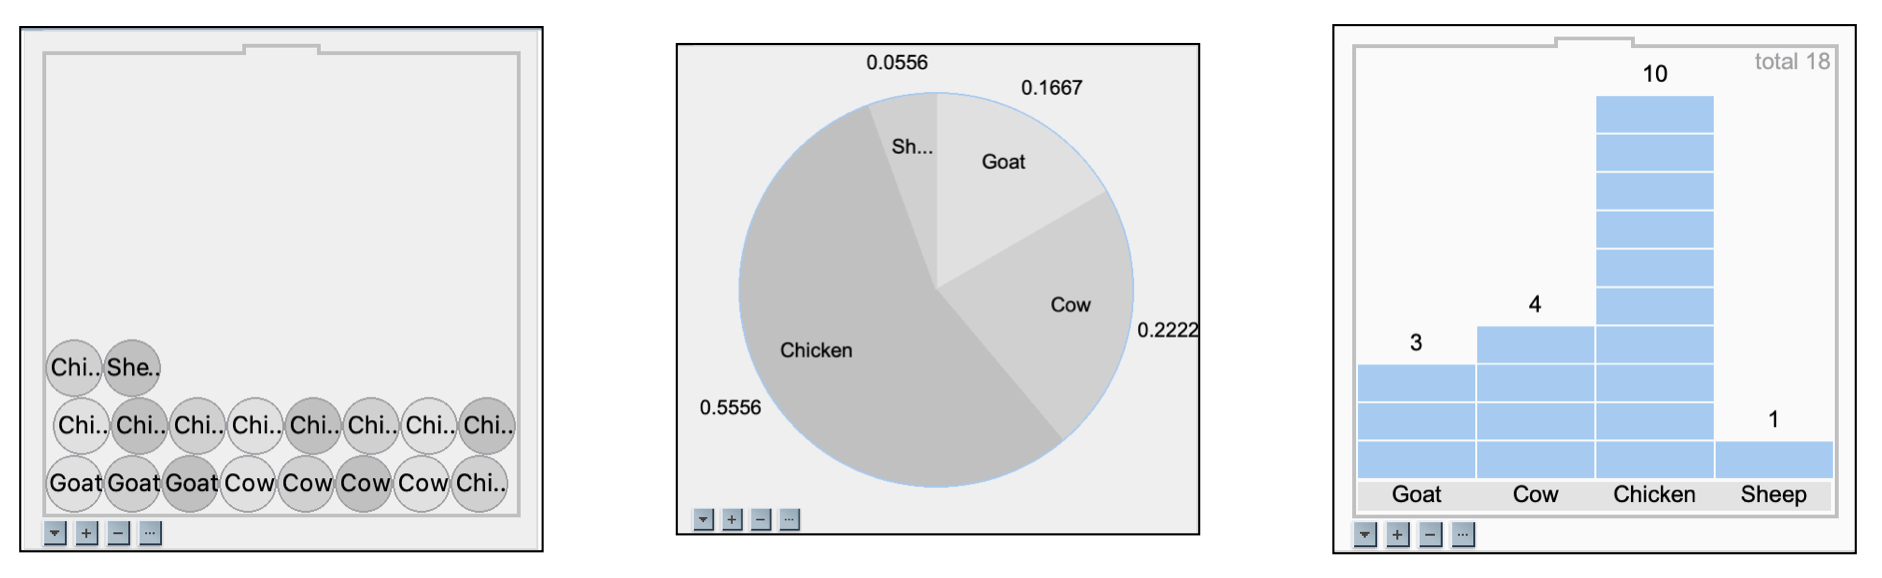
Just seeing these different sampling devices might bring to mind some advantages and disadvantages of using these devices. For example, the mixer requires us to record each individual animal on a seperate ball. While we can easily see each ball, we need to double-check the counts (which are not shown in the sampling device). The spinner requires us to indicate the probability (or proportion) for each type of animal rather than the counts. The stacks device seems to be the best device for this scenario as it allows us to easily see the counts of each animal. (Often the stacks device is useful when you have many repeats of the same element.) In other modeling scenarios, the mixer or spinner might be a better device to use.
FYI
Throughout the class, you will gain a sense for when one device might be better to use than another device.
Changing the Sampling Device
To change the sampling device from the default mixer:
- Click on the icon of the sampling device you want and drag it into the sampler.
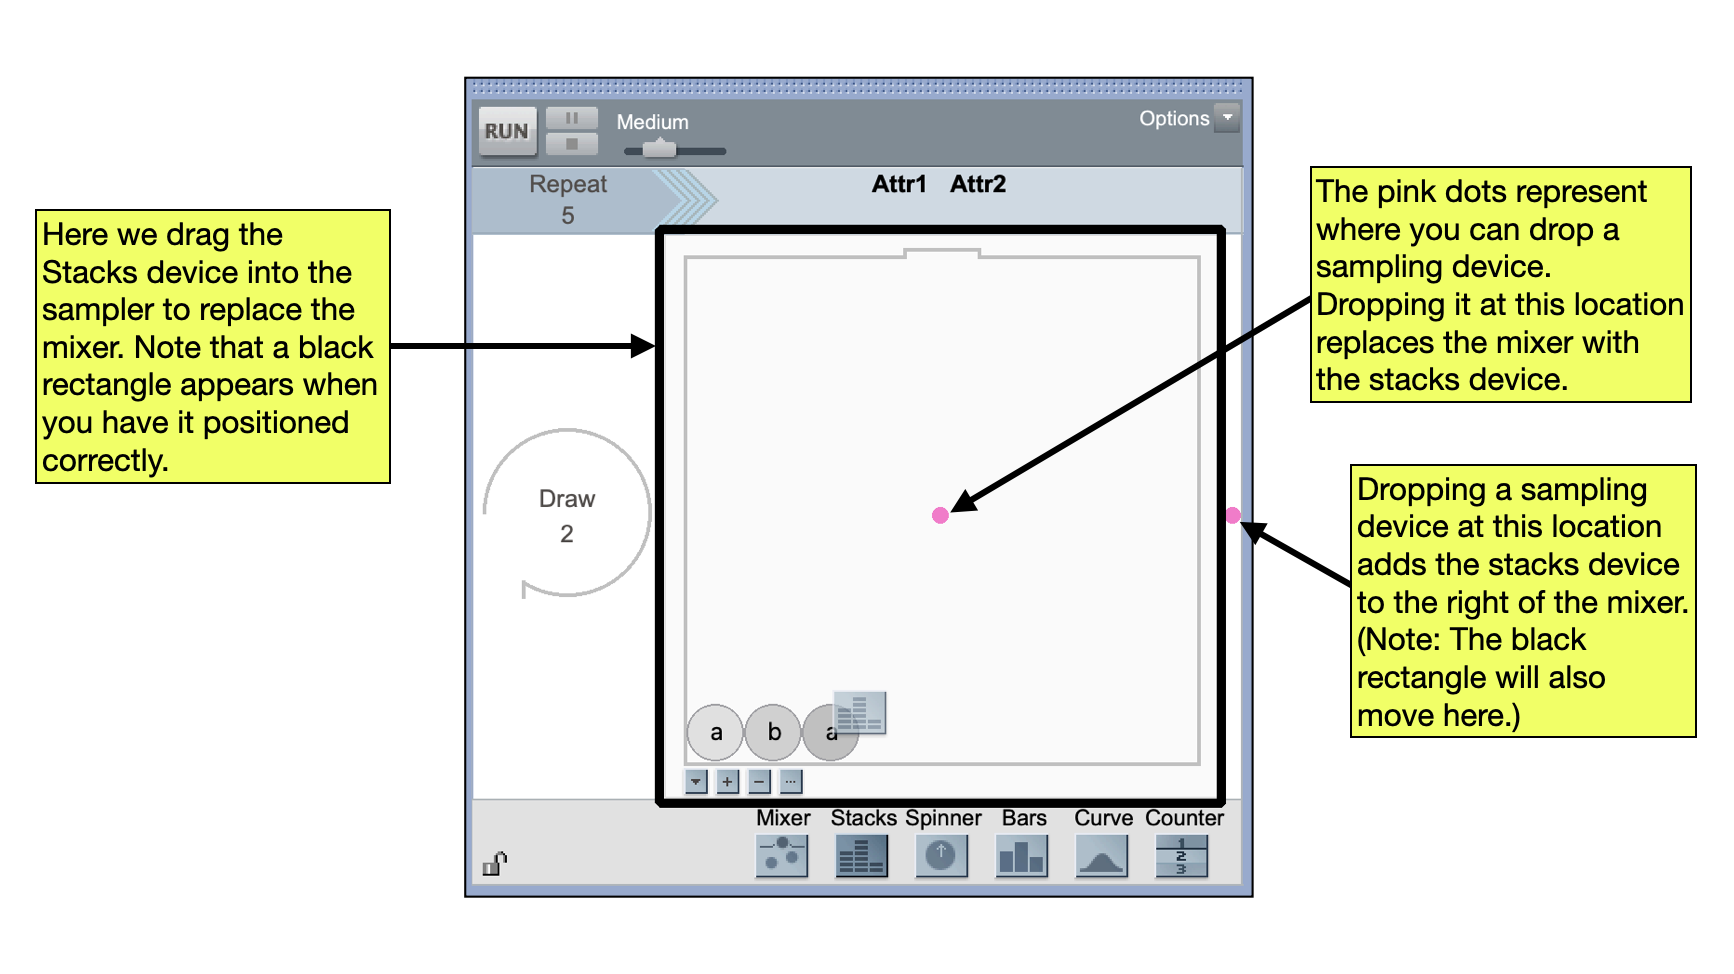
When you drag the new sampling device over the old sampler, you will see two pink dots appear. These are locations where you can drop the new sampling device. You will also see a black outline of a rectangle appear in the sampler. Which pink dot you drop the device on depends on whether you want to replace the old device, or whether you want to add a second device to the sampler.
Adding or Removing Elements
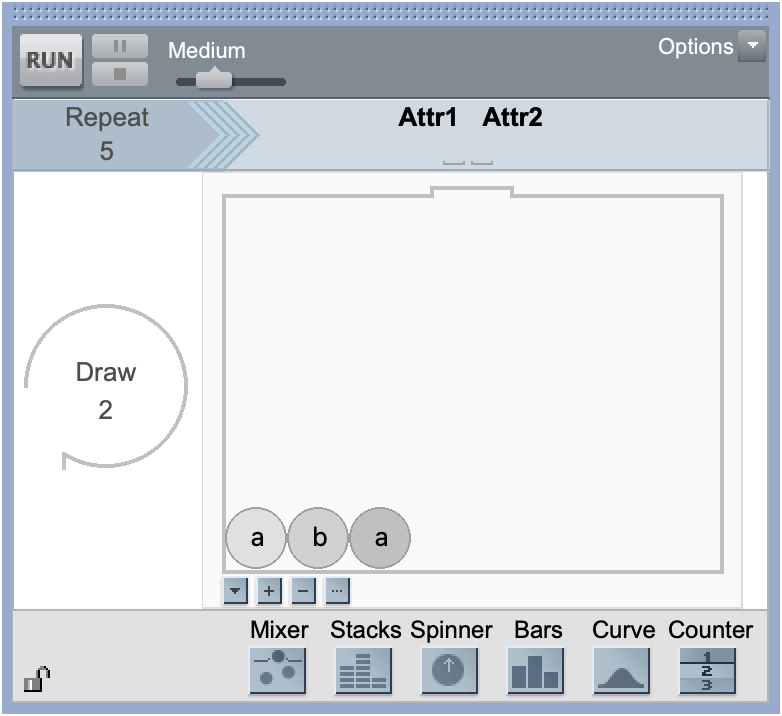
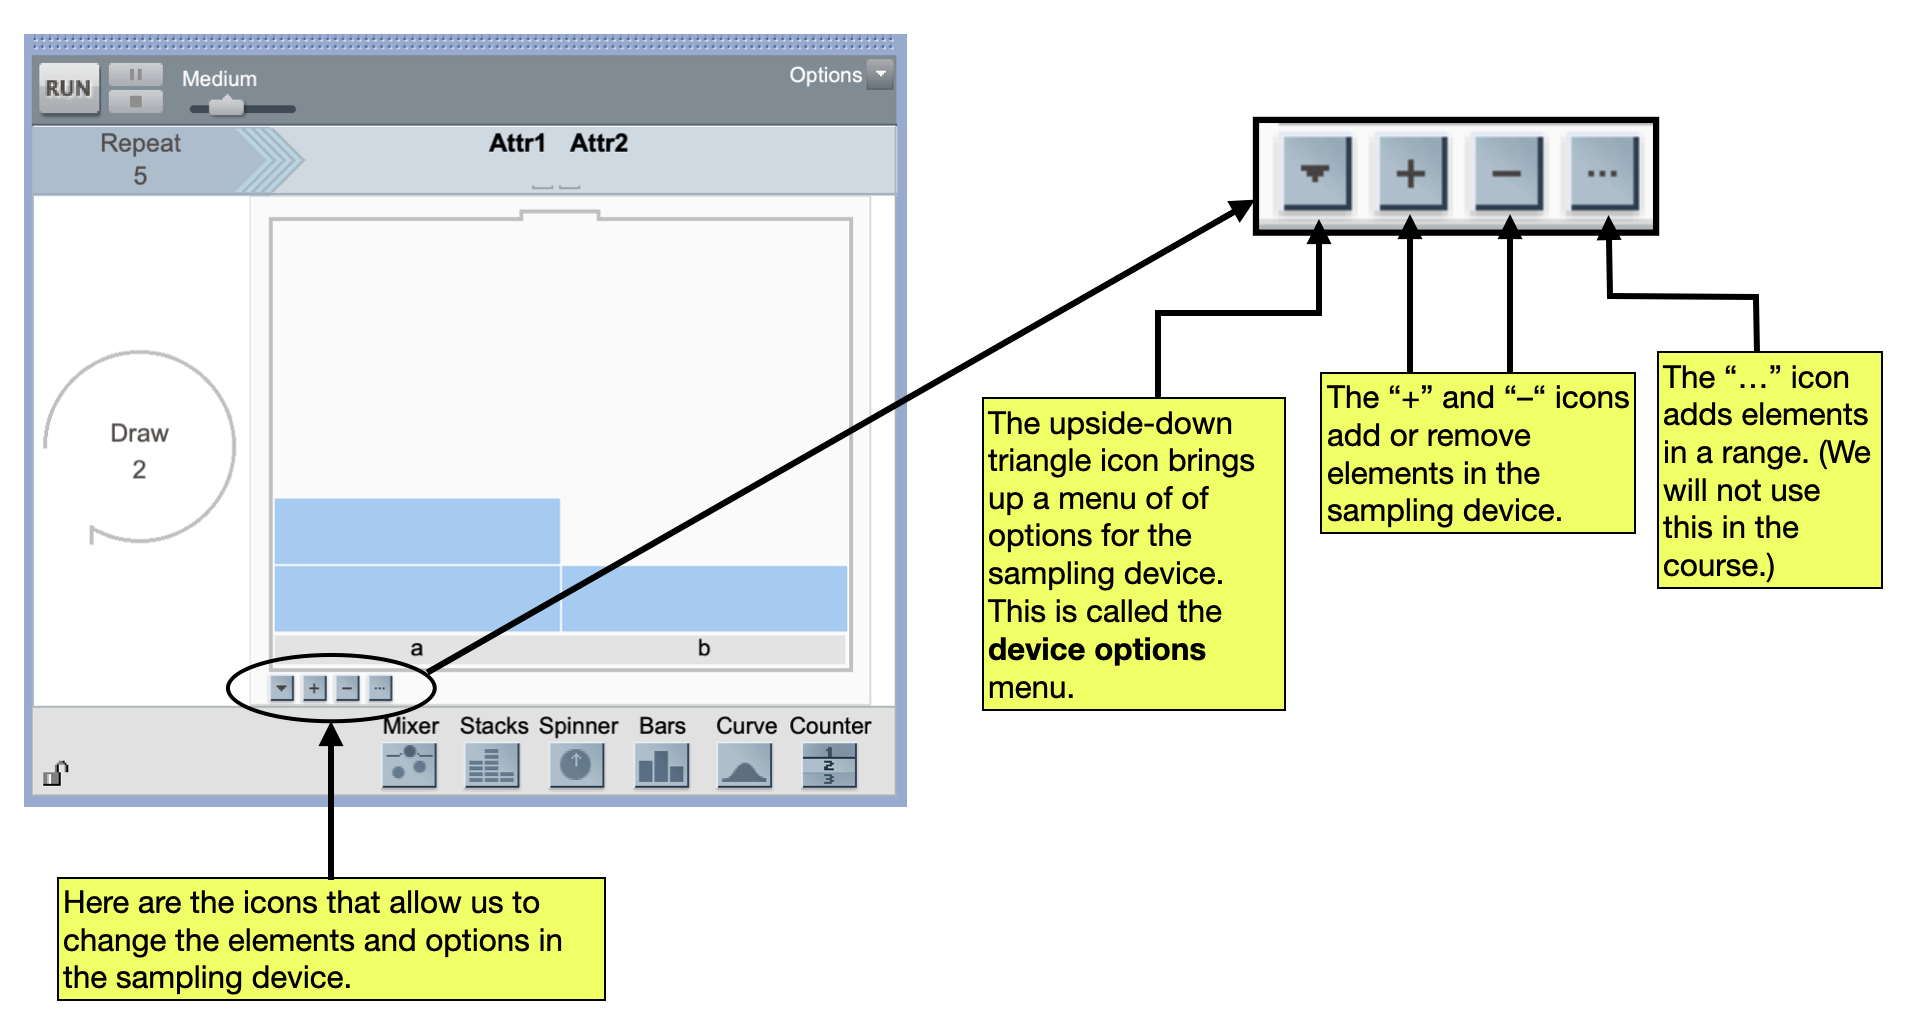
Let’s set up a stacks device to include the 18 animals in our scenario. AFter dragging a sampler into the workspace, and then changing the sampling device to stacks, you should have a device that includes two different stacks: one stack includes two “a” elemnts, and the other stack includes one “b” element. There are four icons below the sampling device. These icons allow us to add or remove elements in the sampling device, and access the options for that sampling device.
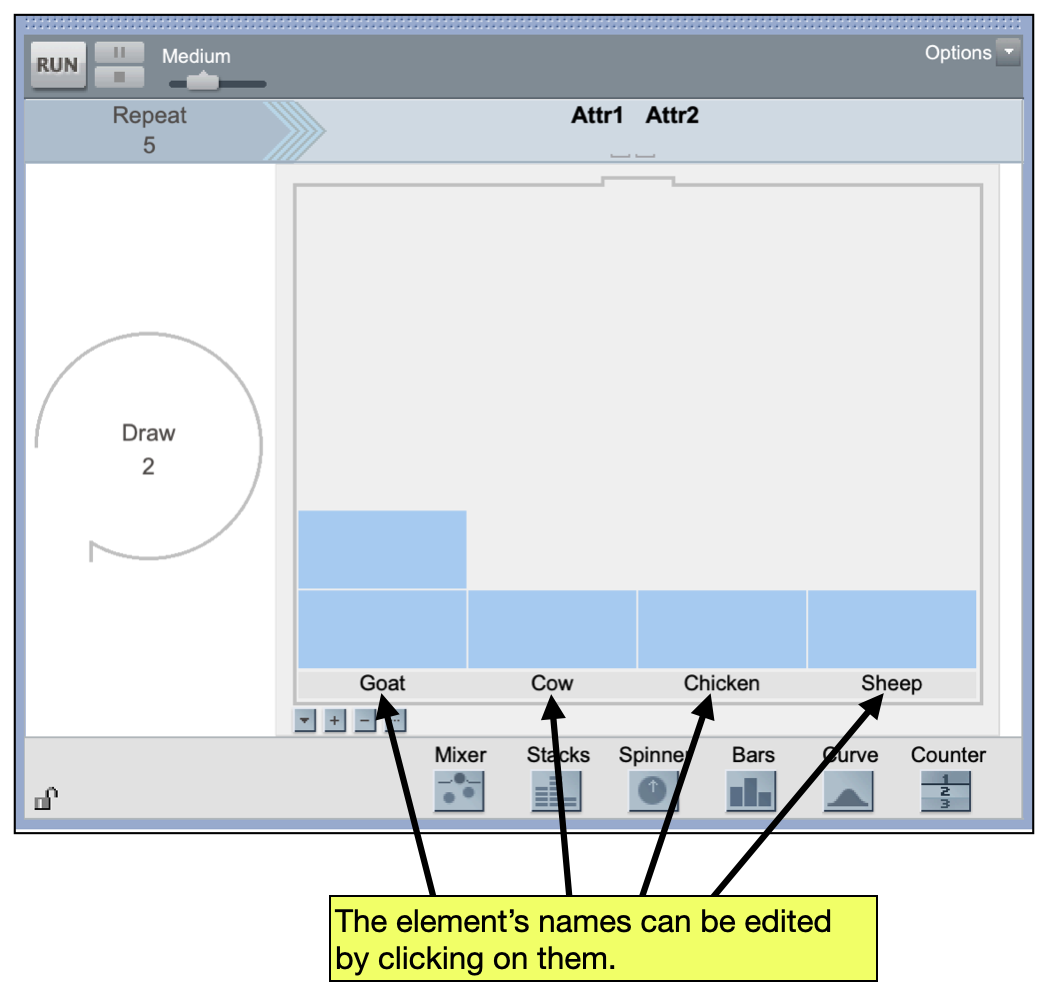
In our scenario, we have four unique elements: goat, cow, chicken, and sheep. Since our current sampler already has two stacks, we need to add two additional stacks by clicking the “+” icon below the sampling device twice. (You should now see four stacks in the sampling device.) Click on the name of each stack (e.g., on “a”) and change each element’s name to reflect the four animals.
Sampling Device Options
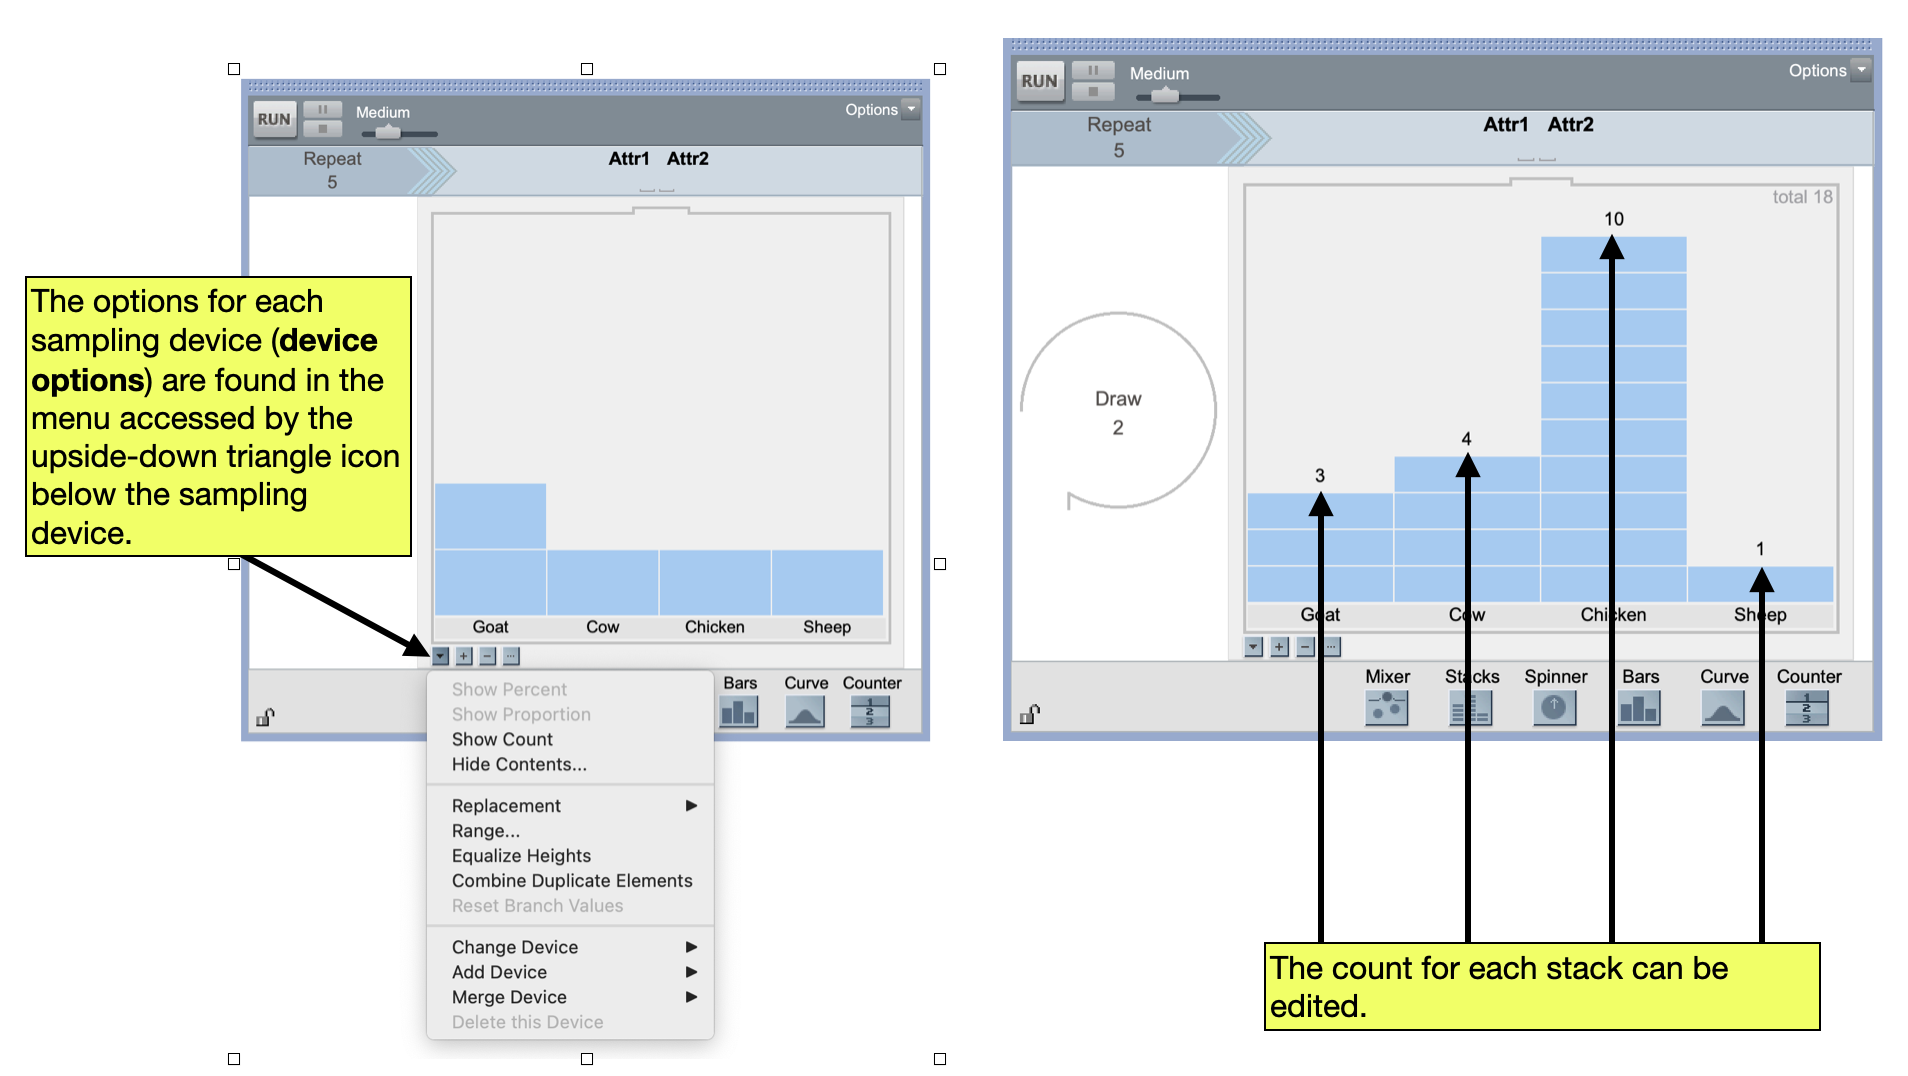
After we have identified our four unique animals, we need to change the height of each stack to reflect the number of each type of animal in our population. We do this by accessing the device options menu for the sampling device. Click the upside-down triangle below the sampling device to bring up the device options menu. There are several options available there, but we want to Show Count. Selecting this will bring include the count for each of our four animal types. Edit these to reflect the number of each type of animal in the population:
- Three goats
- Four cows
- Ten chickens
- One sheep
FYI
Different sampling devices will have different options.
Sampler Settings: Draw and Repeat
The Draw and Repeat values are two settings that we need to specify when we set up a simulation. The Repeat value is always set to the number of cases that you want to generate in a single trial (i.e., run) of the the simulation. For example, say we wanted to randomly generate seven animals from our population of animals. In that case, we would set the Repeat value to 7.
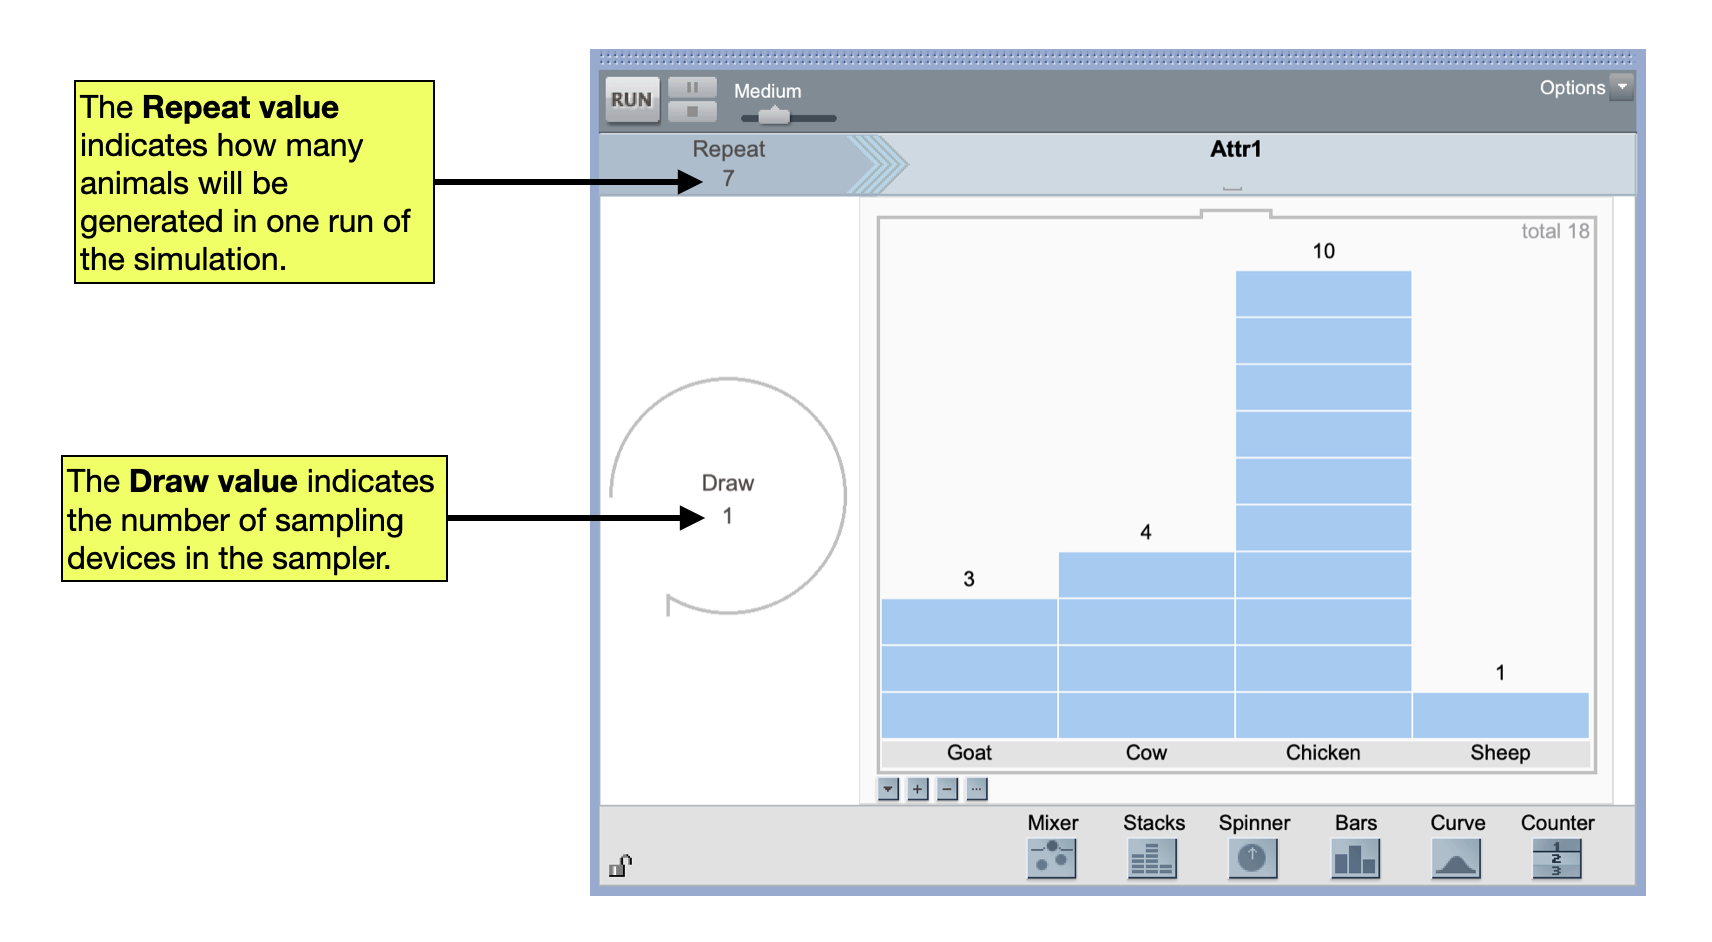
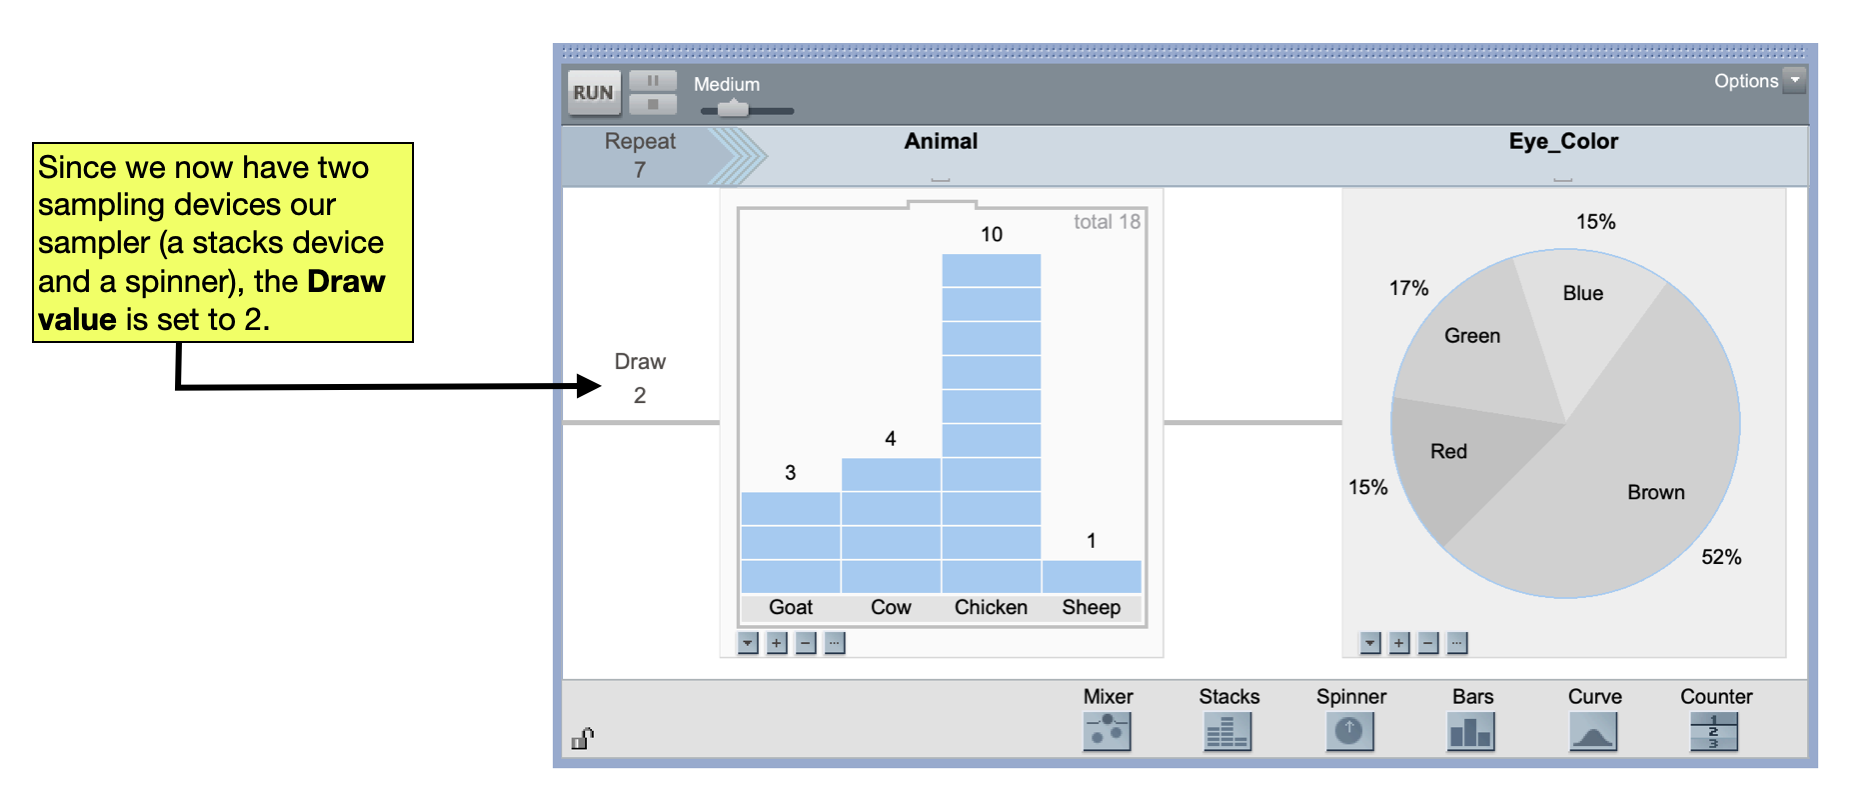
The Draw value is always set to the number of sampling devices included in the sampler. In our example, there is only a single sampling device included in the sampler. Because of this, the the Draw value should be set to 1. Later in the course, you will be setting up samplers with multiple sampling devices. In those cases, you will need to change the Draw value to reflect however many sampling devices are included in your sampler.
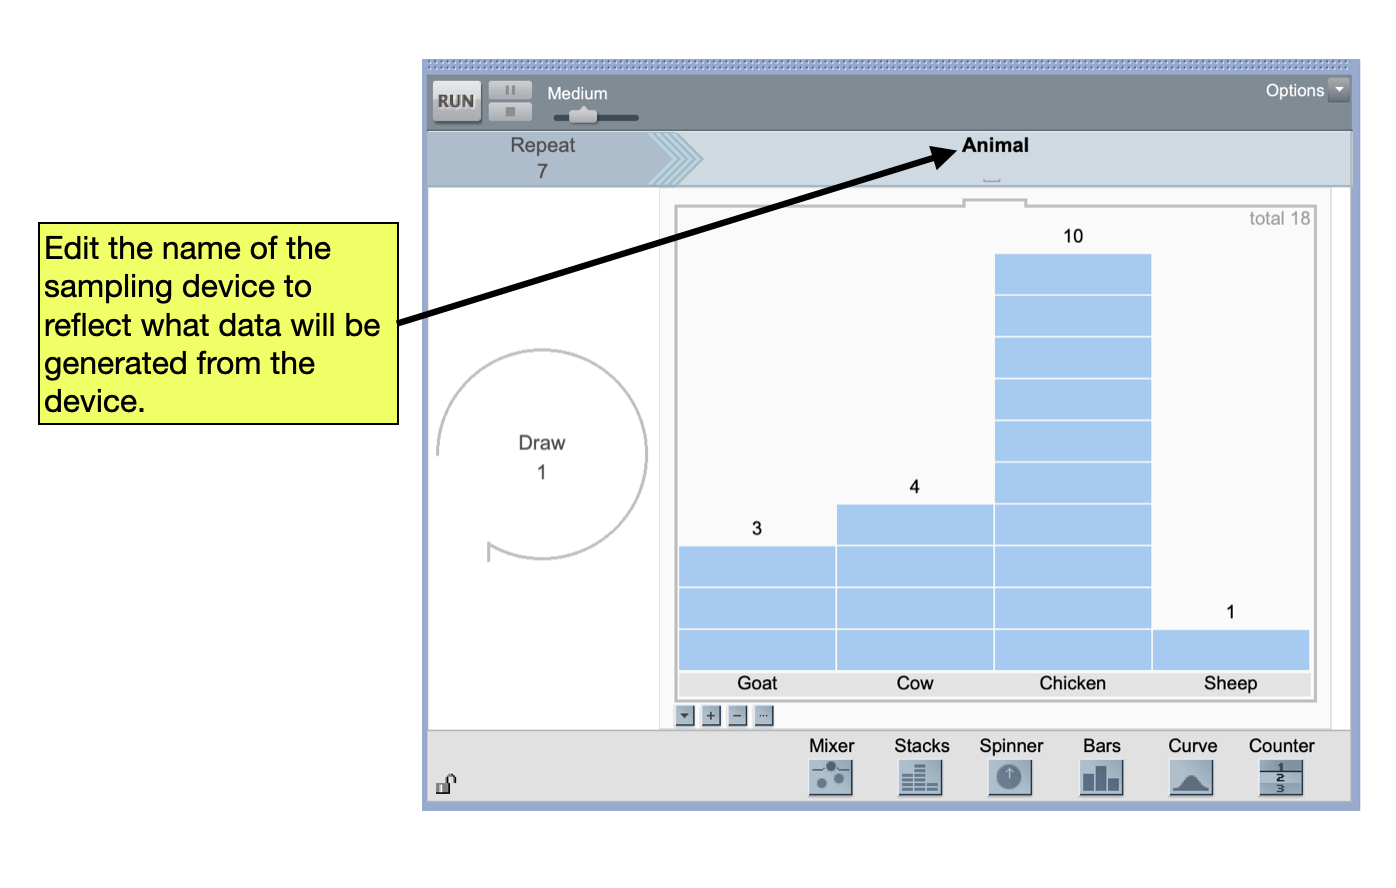
Naming the Sampling Device
Lastly, you will want to name the sampling device. The default name “Attr1” does not describe what is being generated from the sampling device. In our scenario, a better name might be “Animal”.
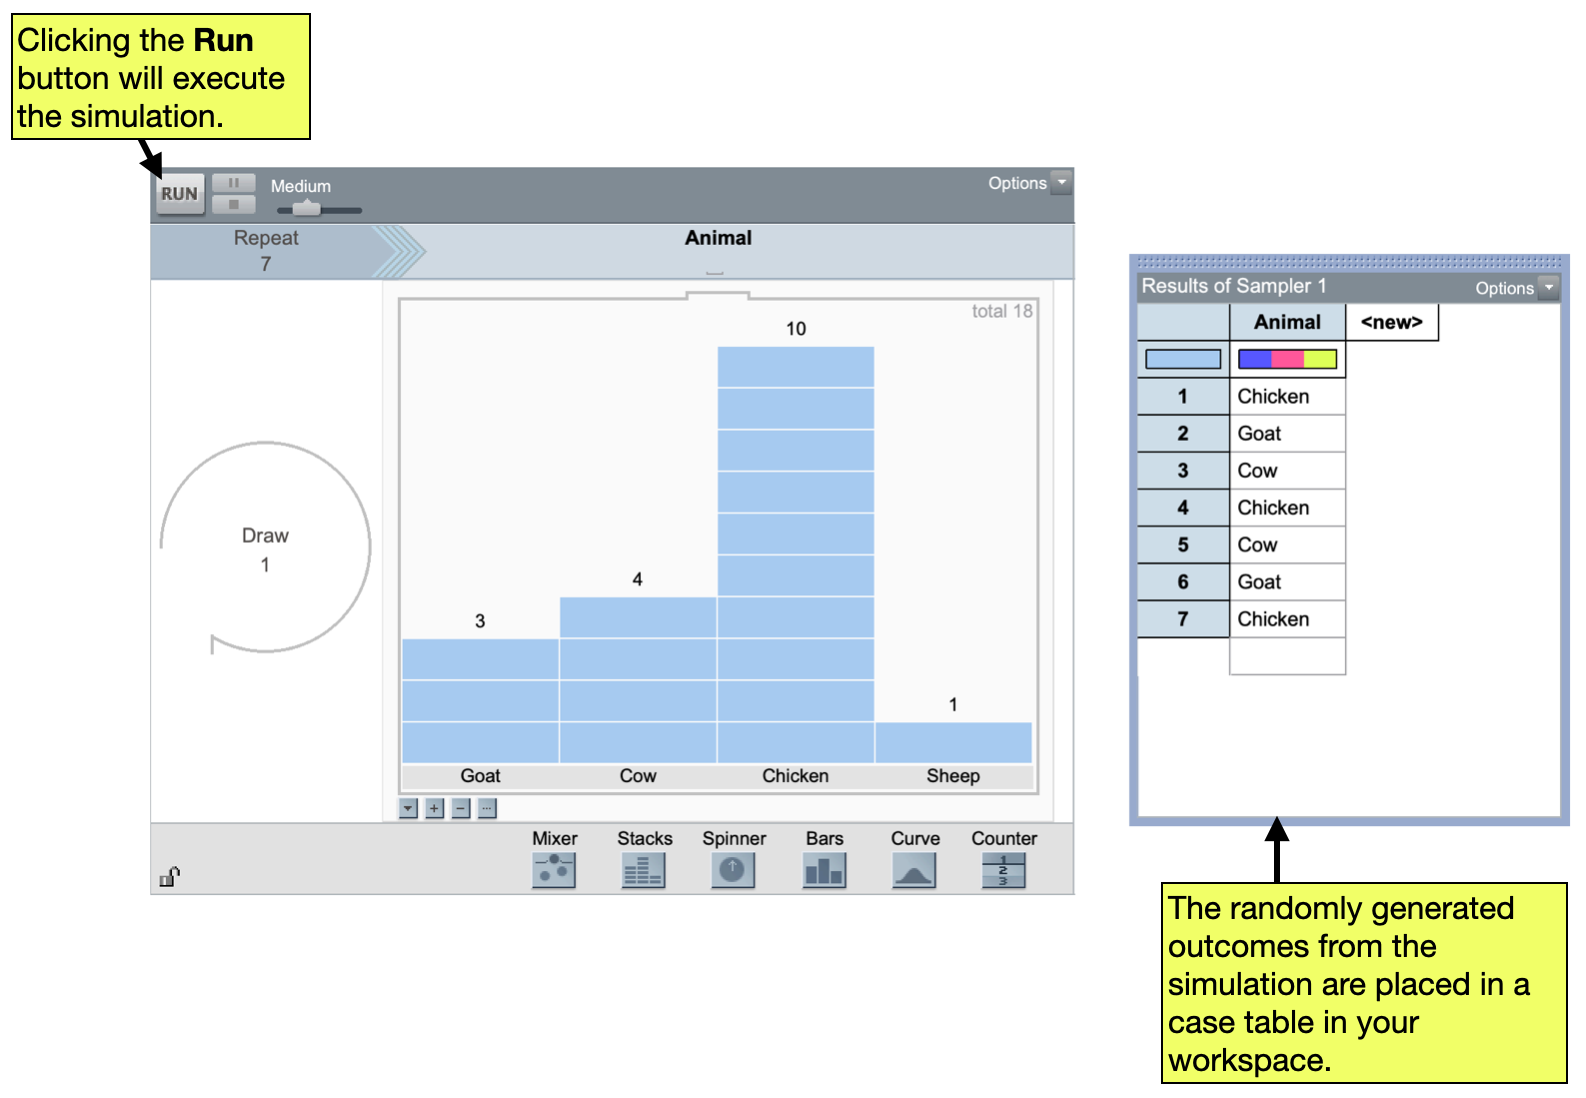
Running the Simulation
Once we have completely set up our sampler, we can run the simulation. To do this, click the Run button in the top-left of the sampler. This will start the simulation, which was set up to randomly generate seven animals from our population. These generated outcomes are entered into a case table in the TinkerPlots workspace.