Evaluating Hypotheses with Compatibility Intervals
As you learned in the Helper or Hinderer: Revisited activity, we can use the compatibility interval to evaluate statistical hypotheses. The key to this is that the compatibility interval gives a range of plausible values for the parameter. Any value in the compatibility interval is a reasonable value for the parameter given the observed data we have. In other words, if we were to carry out a hypothesis test where the null hypothesis was that the parameter is equal to a value in the interval, we would fail to reject that null hypothesis based on our data.
As an example, let’s say we want to estimate the average price (in thousands of dollars) for a houses/condo in a neighborhood adjacent to the University of Minnesota Twin Cities campus (e.g., Marcy-Holmes, Cedar-Riverside, Como). On May 19, 2025, there were 40 houses/condos available for sale on Zillow.com in these neighborhoods. These data were entered into TinkerPlots and a bootstrap analysis was undertaken to estimate the standard error of the average price. Here are the resulting values:
- Point estimate: $335.79k
- Standard Error: $25.09k
- Margin of Error: $50.18k
The compatibility interval for the average house price is: \(\big[285.61, ~~385.97\big]\). We can interpret this as:
We are 95% confident that the average house price for a house/condo in a neighborhood near the University of Minnesota Twin Cities is between $285.61k and $385.97k.
What this implies is that:
- $290k is a plausible value for the average price of a house/condo in a neighborhood near the University of Minnesota.
- $300k is a plausible value for the average price of a house/condo in a neighborhood near the University of Minnesota.
- $325k is a plausible value for the average price of a house/condo in a neighborhood near the University of Minnesota.
- $350k is a plausible value for the average price of a house/condo in a neighborhood near the University of Minnesota.
- $385k is a plausible value for the average price of a house/condo in a neighborhood near the University of Minnesota.
In fact, any value in the interval would be a plausible value for the population average price of a house in a neighborhood near the University of Minnesota. When we evaluate a statistical null hypothesis, say:
\[ H_0: \mu = \$400k \] we are really asking the question is the value expressed in the null hypothesis a plausible value given the data. In this case we are asking whether $400k is a plausible value for the population average given the data. When we reject the null hypothesis, that is indicating that the value is not plausible given the data. When we fail to reject the null hypothesis, it is indicating that the value is plausible given the data.
In the null hypothesis above, we would reject the null hypothesis since $400k is not a plausible value as evidenced in the compatibility interval. In other words, a population average house price of $400k is not compatible with the data we observed. This is why we call the interval a compatibility interval.
Using Compatibility Intervals to Compare Groups
Now say we want to estimate the average price (in thousands of dollars) for a houses/condo in a neighborhood adjacent to the University of Minnesota Duluth campus (e.g., Chester Park, Congdon Park, Hunter’s Park, Kenwood). On May 19, 2025, there were 25 houses/condos available for sale on Zillow.com in these neighborhoods. These data were entered into TinkerPlots and a bootstrap analysis was undertaken to estimate the standard error of the average price. Here are the resulting values:
- Point estimate: $496.28k
- Standard Error: $80.86k
- Margin of Error: $161.72k
The compatibility interval for the average house price is: \(\big[334.56, ~~658.00\big]\). We can interpret this as:
We are 95% confident that the average house price for a house/condo in a neighborhood near the University of Minnesota Duluth is between $334.56k and $685.00k.
Is the average house/condo price more expensive near the Duluth campus? Or near the Twin Cities campus? Based on the point estimates, the average house/condo price near the Duluth campus ($496.28k) is more expensive than that near the Twin Cities campus ($335.79). But what about after we account for uncertainty?
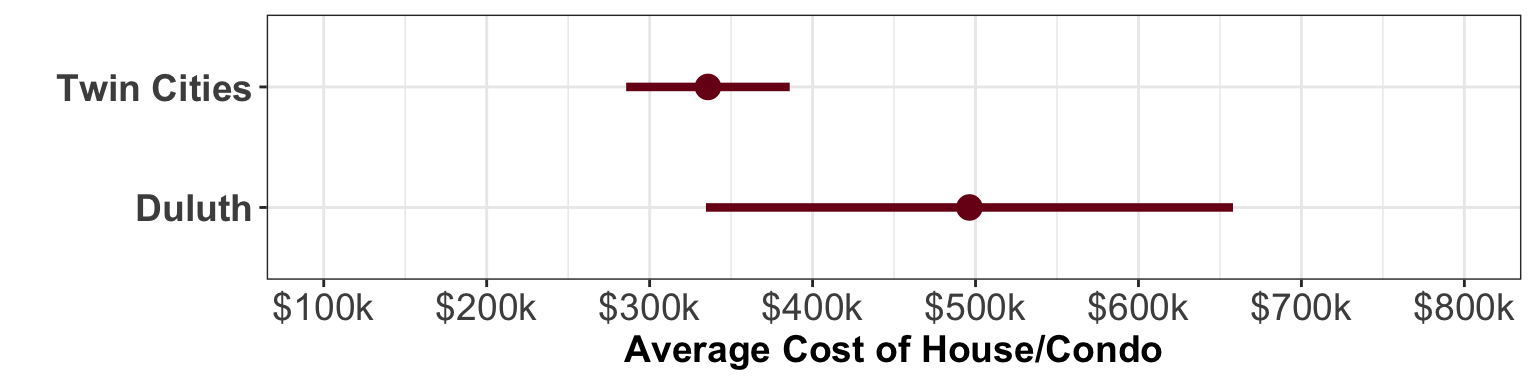
When you compare compatibility intervals, it is often easiest to plot the compatibility intervals. Figure 1 shows an example of this for the compatibility intervals for Duluth and the Twin Cities.
As you interpret the compatibility intervals, remember that any value in the compatibility interval is a plausible value for the average. Because of this, if the intervals overlap, that suggests the parameter may be the same for the two groups. Based on our two intervals, it may be that:
- The average cost of a house/condo in a neighborhood near the Duluth campus is higher than the average cost of a house/condo in a neighborhood near the Twin Cities campus. For example, the average cost in Duluth may be $600k and the average price in the Twin Cities may be $300k (these are plausible values in the compatibility intervals).
- The average cost of a house/condo in a neighborhood near the Duluth campus is the same as the average cost of a house/condo in a neighborhood near the Twin Cities campus. For example, the average cost in Duluth qnd the Twin Cities may be $350k (these are plausible values in the compatibility intervals).
- The average cost of a house/condo in a neighborhood near the Twin Cities campus is higher than the average cost of a house/condo in a neighborhood near the Duluth campus. For example, the average cost in the Twin Cities may be $380k and the average price in Duluth may be $340k (these are plausible values in the compatibility intervals).
Because of the overlap in the intervals, it is unclear which of these is the case. There is too much uncertainty to make a decision about which location has the higher average cost. In terms of our null hypothesis:
\[ H_0: \mu_{\text{Duluth}} = \mu_{\text{Twin Cities}} \]
the overlap would cause us to fail to reject the null hypothesis that they are the same. It may be that they are the same.
PROTIP
Failing to reject the null hypothesis does not imply you are saying that the two groups have an equal mean. It just means it is a possibility. As you saw with the compatibility intervals, it may be that they are the same, or that one is higher than the other…we just have too much uncertainty to make a decision.
If the intervals did not overlap, then you could make a clear distinction about which location has a higher average price for a house/condo near the campus. For example, Figure 2 compares the average price of a house/condo near the University of Minnesota Duluth and Crookston campuses. (The Crookston CI = \(\big[222.72, ~~306.12\big]\).)
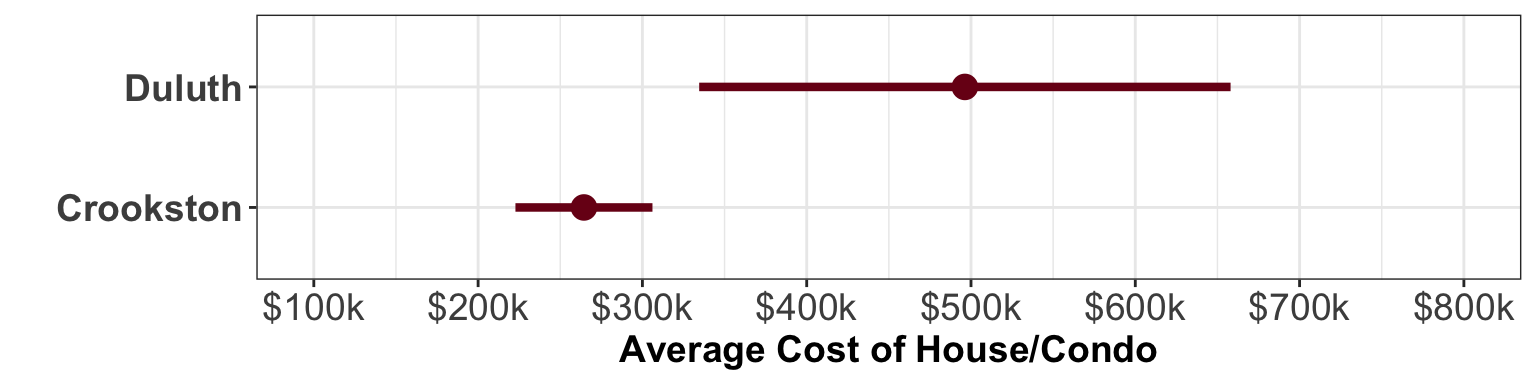
Every plausible value in the compatibility interval for the average price of a house/condo near the Duluth campus is higher than every plausible value in the compatibility interval for the average price of a house/condo near the Crookston campus. This implies that the average price of a house/condo near the Duluth campus is higher than for one near the Crookston campus. If we were testing the null hypothesis:
\[ H_0: \mu_{\text{Duluth}} = \mu_{\text{Crookston}} \]
We would reject the null hypothesis. The two averages being equal is not plausible given the compatibility intevrals. Although we can say that the average price is higher for Duluth than Crookston, it is a bit more unclear about how much higher a house/condo in Duluth is than Crookston since there is uncertainty in both averages.
- Based on the CIs, the largest plausible value for Duluth is $658k while the smallest possible value for Crookston is $264.42k. This results in a difference of $393.58k.
- Also based on the CIs, the smallest plausible value for Duluth is $496.28k while the largest possible value for Crookston is $306.12k. This results in a difference of $190.16k.
Based on the CIs, the average price of a house/condo in Duluth may be anywhere from $190.16k to $393.58k higher than the average price of a house/condo in Crookston.