TinkerPlots 101: Collecting Summary Measures
To use results from simulation studies, we need to have the results from many, many trials. In practice, statisticians might carry out a million or more trials. The process of manually recording the results from each trial and entering those into a case table would be onerous, if not impossible. Because of this, we have the software record and keep track of the result from each trial of the simulation. In TinkerPlots, this is referred to as “collecting” the summary measure from each trial.
Example Simulation Study
To illustrate how to have TinkerPlots record and collect the summary measure from each of the trials, consider the following scenario:
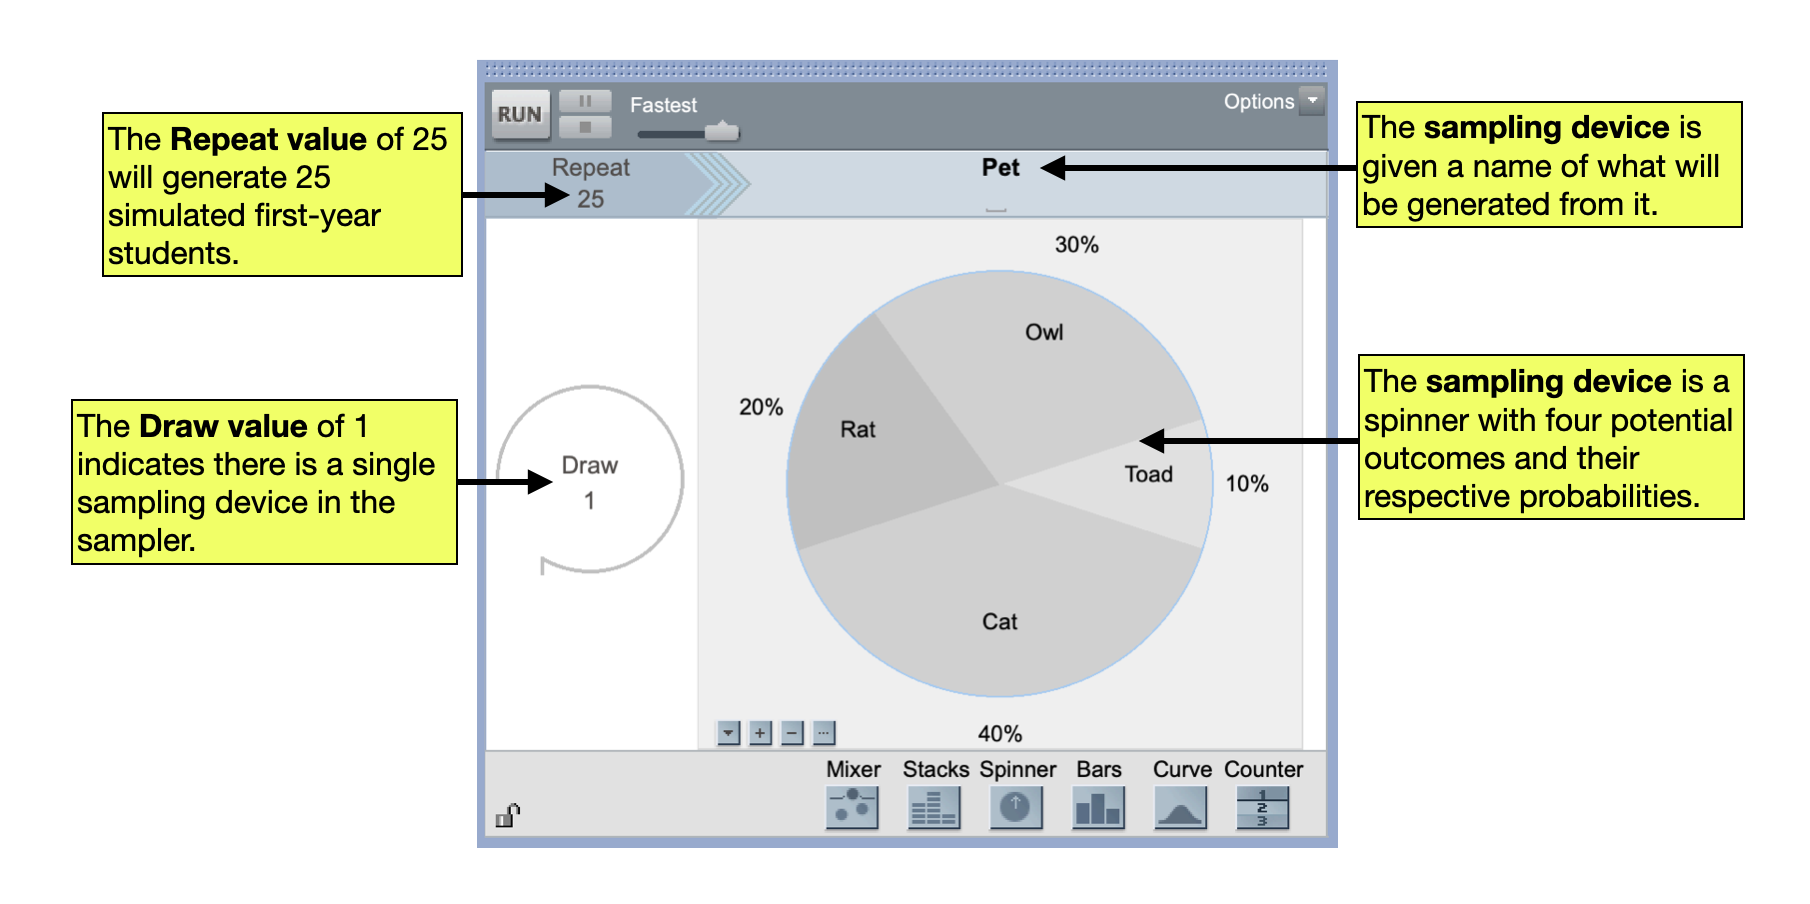
Dumbledore wants to find out how many Hogwarts students out of 25 first-years are likely to have a owl. He know that in the larger magical population about 30% of wizards have owls, 20% have rats, 40% have cats, and 10% have toads. He also took a statistics course, so he would like to conduct a simulation to account for sampling variation in his estimate.
Dumbledore has set up the following TinkerPlots sampler to carry out his simulation study.
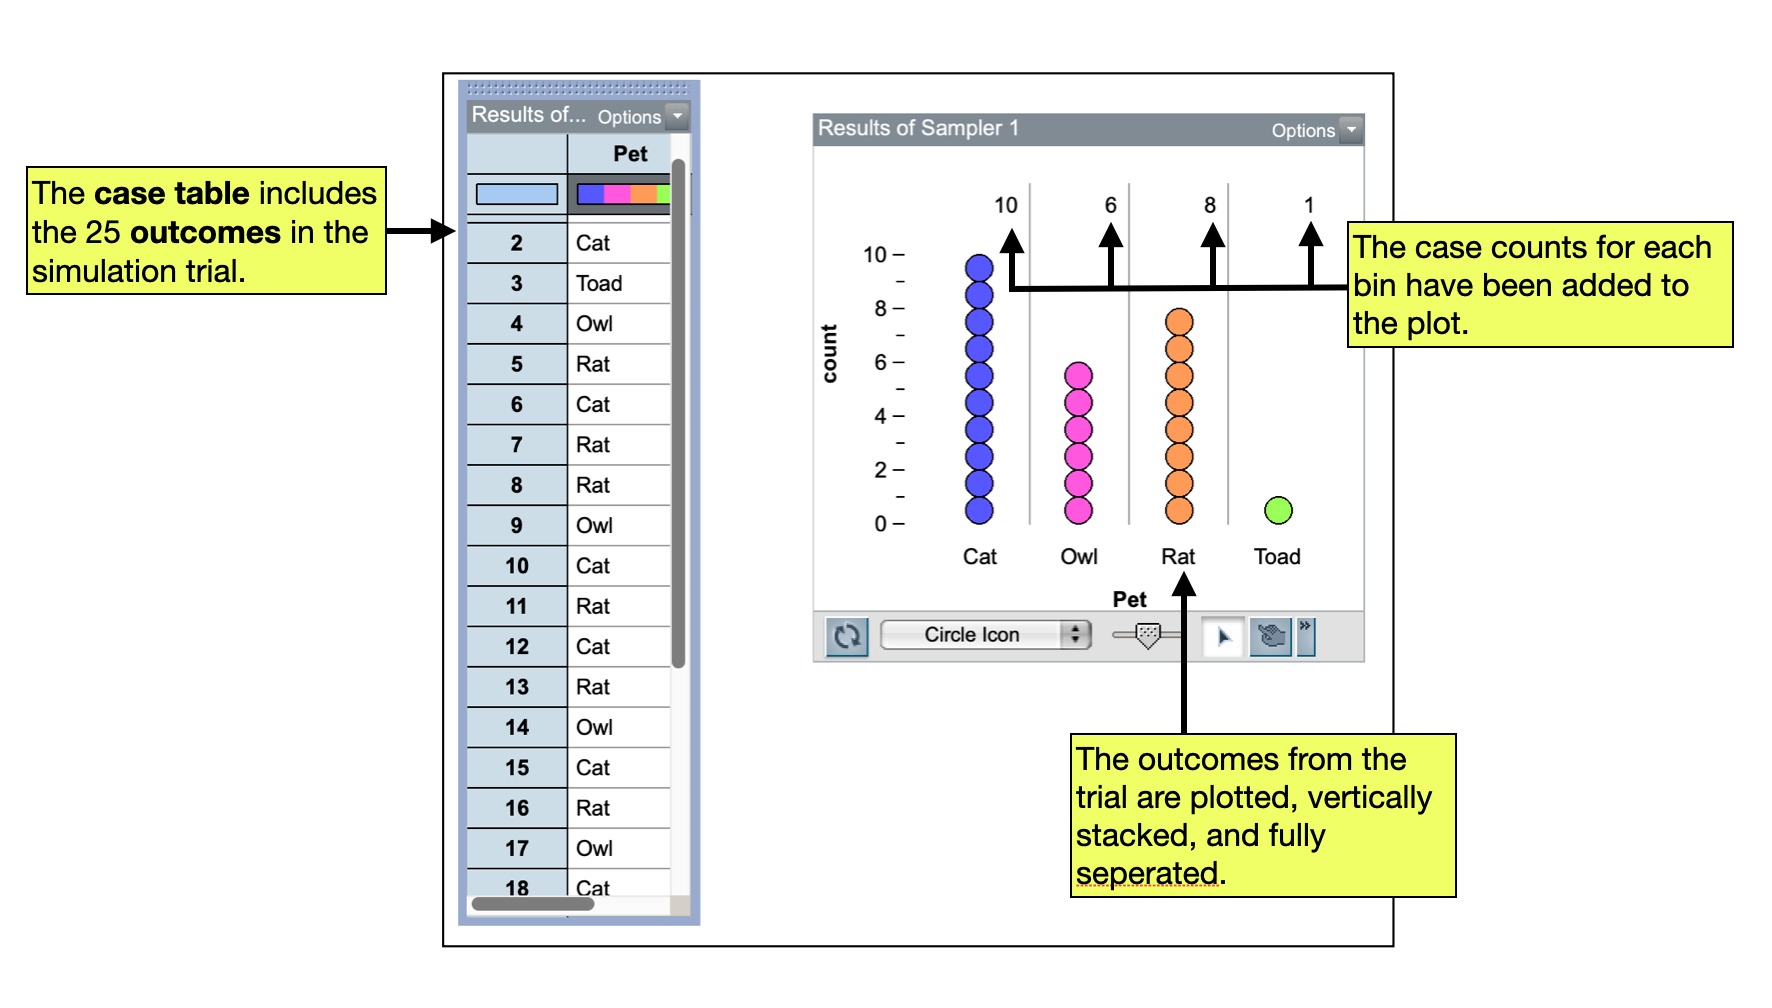
He has also run a single trial and has plotted the results. He has also summarized the results by computing the case counts in each pet bin.
FYI
In order to have TinkerPlots collect the results from your trials, you need to run the first trial of the simulation, plot the outcomes, and add a summary measure to the plot.
Collecting Summary Measures
We collect the summary measure from the plot of results from our first trial. To do this:
- Right-click the value of the summary measure in your plot.
- Select
Collect Statisticfrom the pop-up menu.
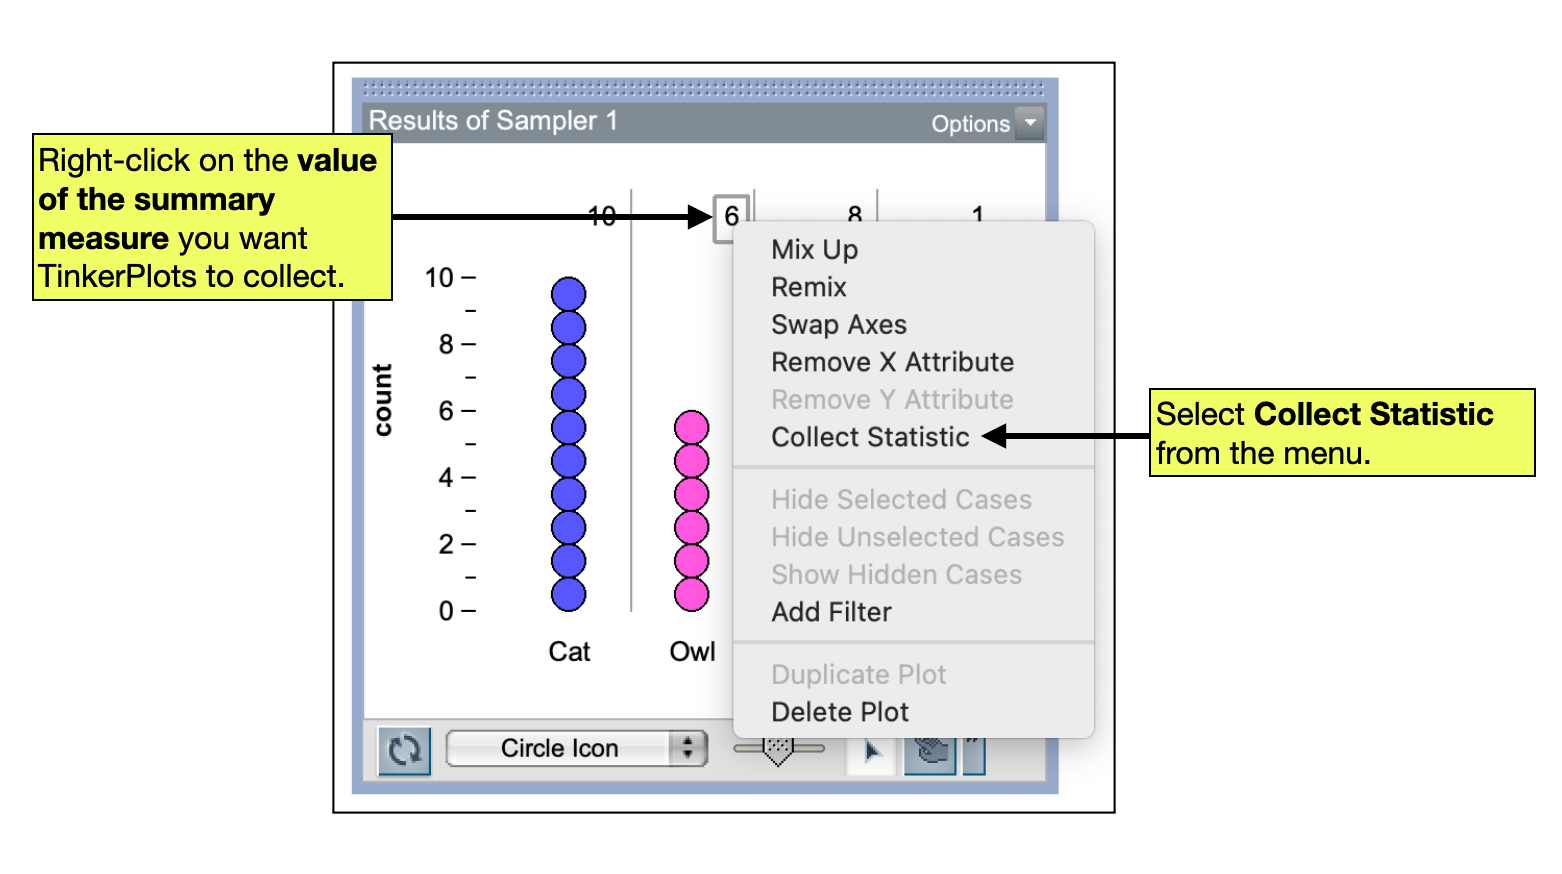
FYI
It is important that you right-click on the actual value of the summary measure in the plot since you want TinkerPlots to collect the value. For example, in the plot displayed above, you would right-click on the value 6 to collect the number of owls.
This will add the summary measure from the pl0t to a case table. You can carry out additional trials and collect the summary measure from those trials by changing the value in the collect box from 1 to another value, say 99. This will carry out 99 additional trials and collect the same summary measure from those trials as you did in the first trial. After changing the value, click the Collect button.
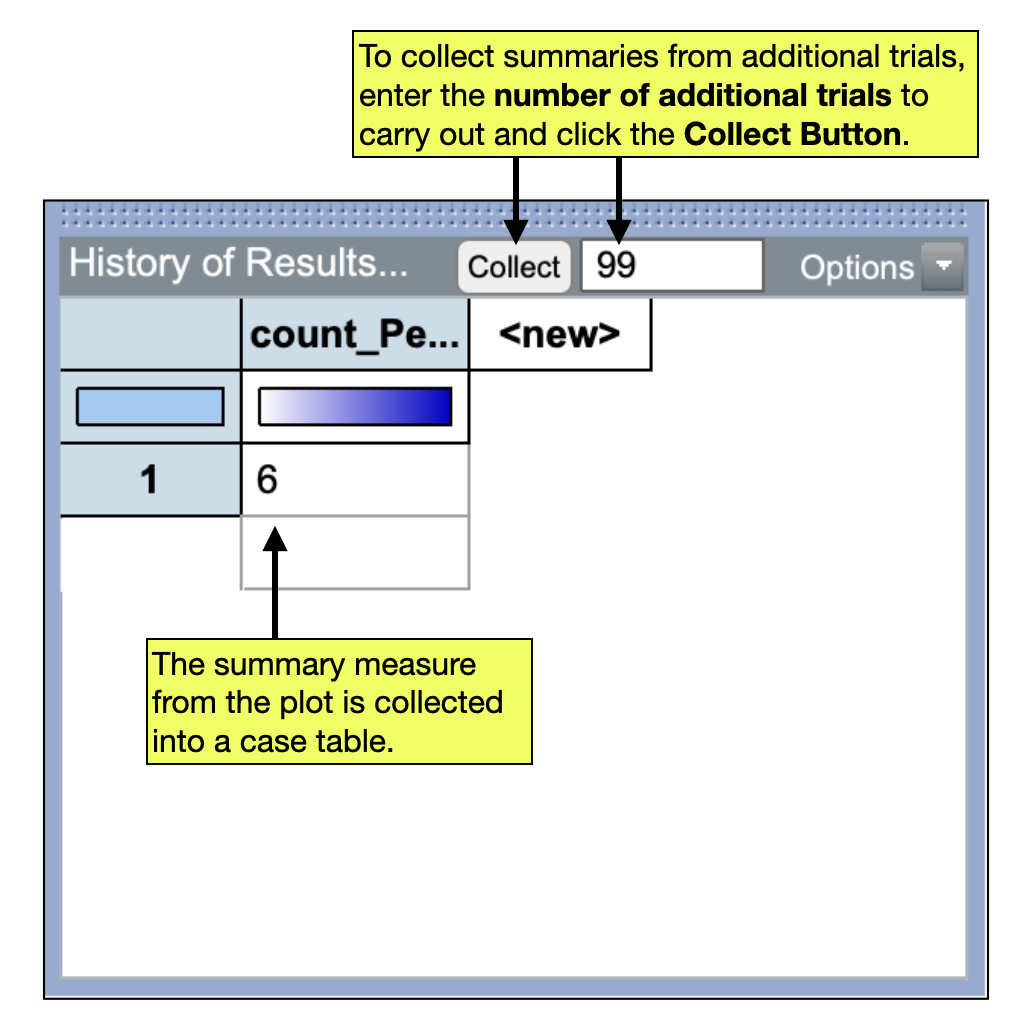
You should see an additional 99 summary measures added to your case table. (When it finishes, you should have a total of 100 summary measures in the case table! The summary from the first trial, and the additional 99 summary measures from the trials you just collected.) These summary measures can be plotted and summarized the same as any other data we have in a case table.
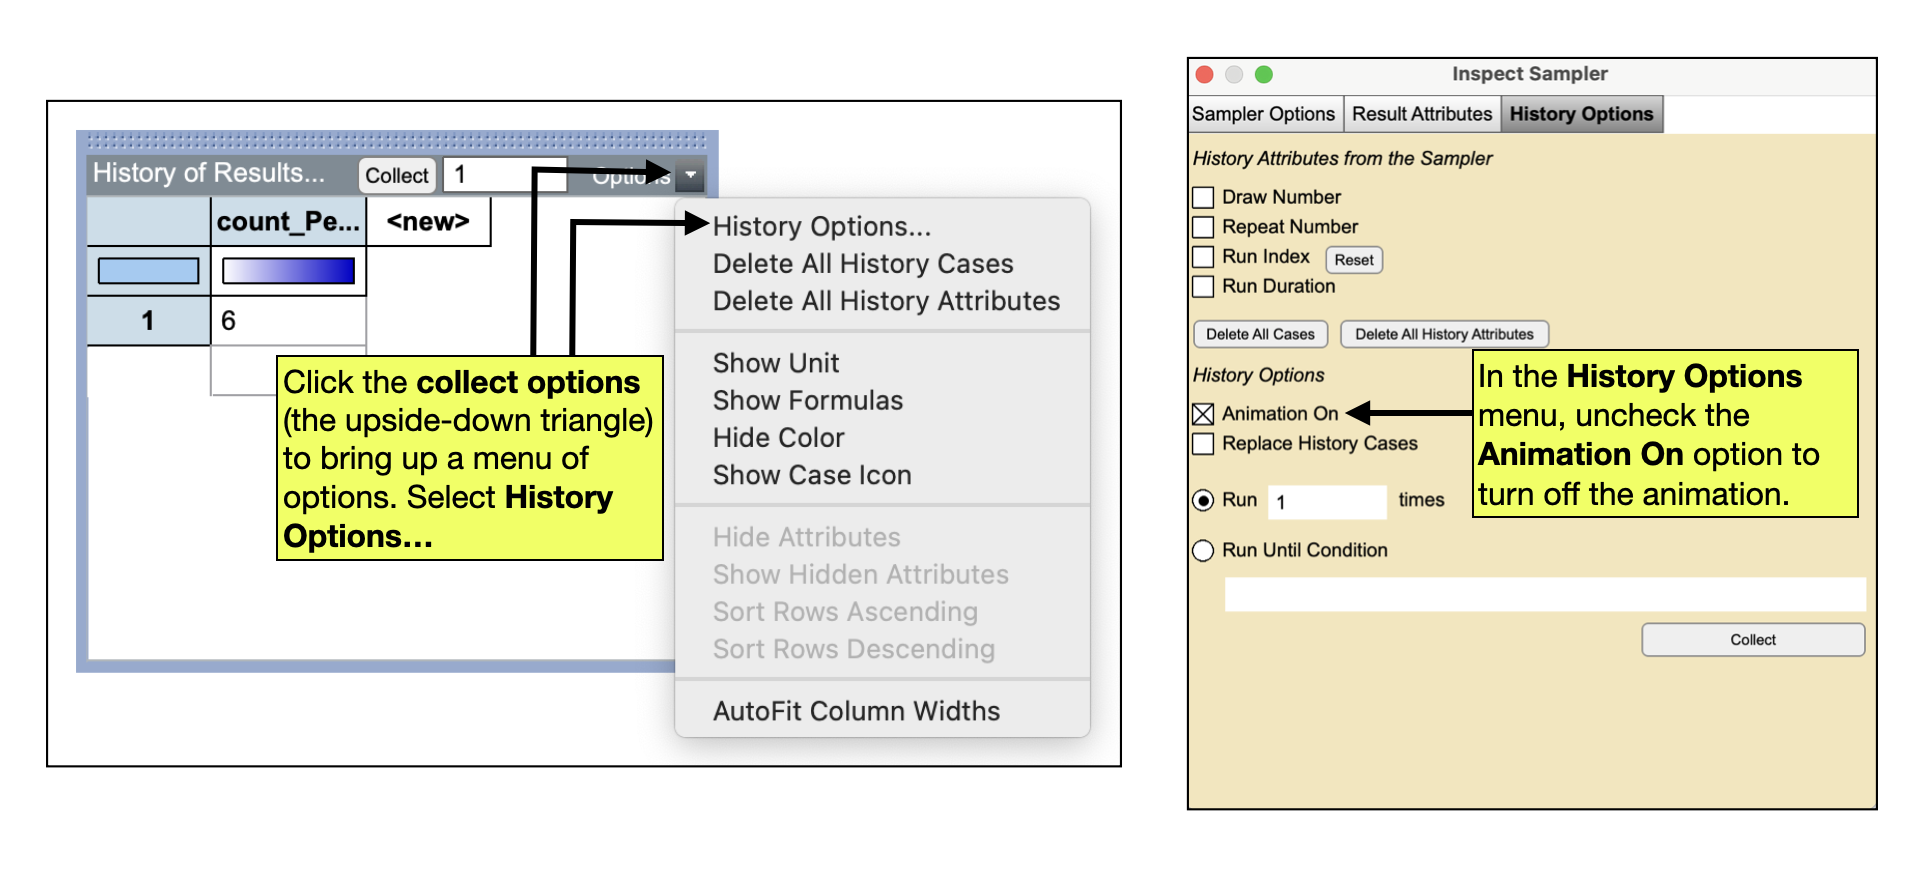
Turning Off the Animation: Faster Collecting
While the collection in TinkerPlots is faster than doing the simulation by hand, we can speed up the simulation by turning off the animation. To do this, click in the Collect Options (the upside-down triangle in the collect case table) and select History Options.... In the new menu, uncheck the Animation On option. The speed of the collection should now be much faster.