Monte Carlo Simulation
Monte Carlo simulation is one method that statisticians use to understand real-world phenomena. In Monte Carlo simulation, a model is used to generate multiple (sometimes millions) of data sets. By examining the data sets produced (or summaries of the data sets produced), researchers can draw insight about and predict what might happen in the real-world under a given set of circumstances. You can read about the fascinating origins of Monte Carlo simulation in the following article:
Carsey & Harden (2014) define Monte Carlo simulation as,
any computational algorithm that randomly generates multiple samples of data from a defined population based on an assumed data generating process (DGP). The DGP is the mechanism that characterizes the population from which simulated samples of data are drawn. Then the researcher explores patterns that emerge across those simulated samples.
This definition of a Monte Carlo simulation implies that the process for carrying out such a simulation encompasses:
- Defining a population or model;
- Randomly generating several samples of data from the population or model;
- Exploring the patterns that emerge across the simulated samples.
Or, in simpler terms, (1) model, (2) simulate, and (3) evaluate.
Example of a Monte Carlo Simulation Study
In 1978, China introduced the “one-child” policy in order to alleviate social, economic, and environmental problems in China. According to Wikipedia (2015)
The policy officially restricts the number of children married urban couples can have to one, although it allows exemptions for several cases, including rural couples, ethnic minorities, and parents without any siblings themselves. A spokesperson of the Committee on the One-Child Policy has said that approximately 35.9% of China’s population is currently subject to the one-child restriction.
Although the Chinese government has suggested that the policy has prevented more than 250 million births from its implementation to 2000, the policy is controversial both within and outside of China because of the manner in which the policy has been implemented. There have also been concerns raised about potential negative economic and social consequences, in part because many families were determined to have a son. Scholars have wondered how things would change if instead of a one-child policy, a country adopted a “one son” policy. A “one son” policy would allow families to keep having children until they had a son. If a family’s first child is a boy, they would be restricted from having more children. If, however, the first child was a daughter, the family could continue having children until a son was born. For example, they might ask the question,
If China adopted a “one son” policy, how would the policy affect the average number of children per family, which is currently 1.6 (Central Intelligence Agency, 2025)?
Model
One way in which this question could be studied (without actually implementing the policy) would be to conduct a simulation study by modeling this situation and generating many data sets from the model. Consider for a minute how you might model the number of children a particular family would have.
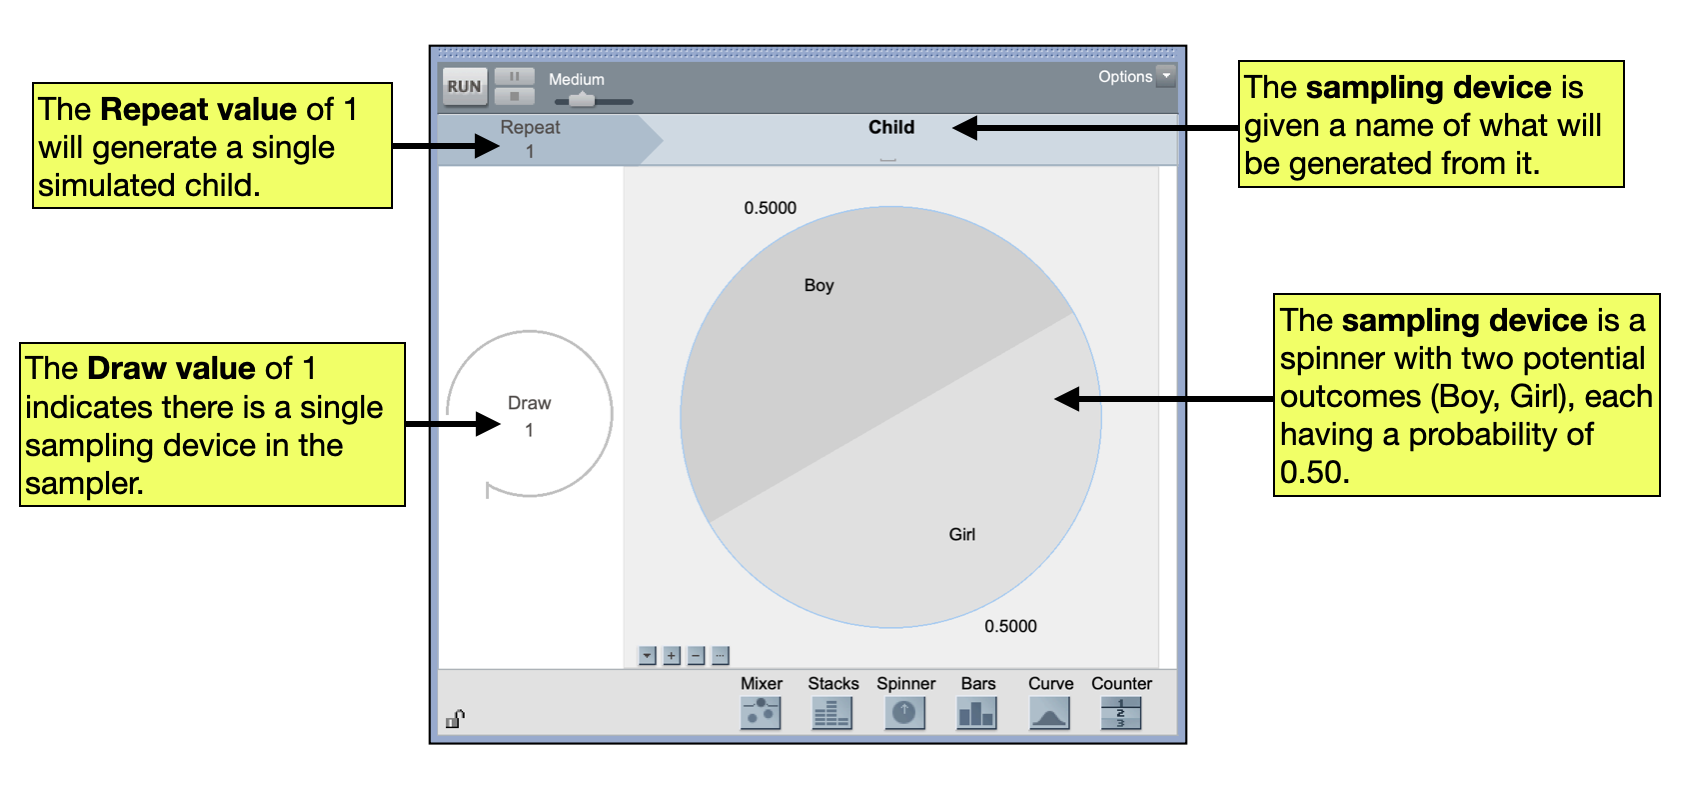
One way to model this is to write the word “boy” on one index card and the word “girl” on another index card and to place those two index cards in a hat. You could also use a TinkerPlots sampler to set up a similar model.
Simulate
After you have a model, the next step in a simulation study is to use the model to generate data. For example, in our index card model, you could mix up the index cards and draw a single card from the hat. If the card has the word “boy” written on it, the simulated “family” would be reported to have one child. If the card has the word “girl” written on it, a tally mark could be recorded and the index card would be replaced in the hat. The cards could then be remixed and another card would be drawn. If the second card drawn has the word “boy” written on it, the simulated “family” would be reported to have two children. If the second card has the word “girl” written on it, another tally mark could be recorded and the index card would again be replaced in the hat. This process would continue until the “boy” card was drawn. The process would be the same if you were using TinkerPlots. But, rather than mixing the index cards and dealing one out, you would click the Run button to generate a child.
The table below shows the results after carrying out this process for three simulated families.
| Family | Girl | Boy | Children |
|---|---|---|---|
| Family #1 | ✔ | ✔ | 2 |
| Family #2 | ✔ | 1 | |
| Family #3 | ✔✔ | ✔ | 3 |
One thing to note is that, not only do we need to record the data that was simulated, but we also need to summarize that data in a way that helps us answer our question of interest. Here the summary we used was the total number of children in the simulated family. This will be true in every simulation study you undertake in the course.
VOCABULARY
Each repetition of the simulation experiment is referred to as a trial of the simulation. In each trial, we compute a summary measure to summarize the outcomes from that trial into a single number.
Evaluate
In practice, we would carry out many trials of this simulation, say running it for 500 families. We would then use the results (the 500 summary measures) to provide an answer to the research question. For example, we could average the 500 summary measures to determine the mean number of children in a family. We could then compare whether this is smaller, equal to, or bigger than 1.6. This comparison would help answer whether the one-son policy impacts the average number of children per family (which is currently 1.6).
Monte Carlo Simulation Assumptions
“Wait,” you say. “Even if I carried out this simulation, I still would not be able to provide an answer to the research question! It doesn’t reflect reality! Some families may not want to have any children, while others might be happy to stop after a girl was born. What about multiple births?”
Maybe you are even questioning whether the probability of having a boy or having a girl is really 50:50. These are all valid points, and all would likely affect the results of the simulation, which in turn affects the inferences and conclusions that are drawn.
While the model used in the “one son” example is overly simplistic for drawing any sorts of meaningful conclusions about implementing such a policy in China, it could still provide a useful starting point for introducing additional complexity. Even in the most enormously complicated modeling problem, researchers often make many simplifying assumptions. (Remember that all models—even those that seem quite complex—are simplifications of reality and get many things wrong.) With enough simplification, a model can be constructed and studied. The model is evaluated and often revised or updated as certain assumptions are deemed tenable and others are not. Because of this process, simulation studies are generally iterative in their development. This iteration process continues until an adequate level of understanding is developed and the research question can be answered.
Monte Carlo Simulation in Practice
In practice, statisticians often use incredibly complex models to generate their data. As an example, Electronic Arts, the video game company behind titles such as Madden, NHL and FIFA, uses game telemetry (the transmission of data from a game executable for recording and analysis) to model the gameplay patterns of players and identify the elements of their games that are highly correlated with player retention (Mateas & Jhala, 2011).
By understanding the behavior of players and the common patterns that are used, Electronic Arts game developers can focus their attention on more relevant features in future iterations of the game and ultimately reduce production costs. For example, in their examination of Madden NFL 11, Electronic Arts used 46 features to model players’ preferences, including their control usage, performance, and play-calling style. This is but one example of using simulation in video games.
References
Carsey, T. M., & Harden, J. J. (2014). Monte Carlo simulation and resampling methods for social science. Sage.
Central Intelligence Agency. (2025). The world factbook. https://www.cia.gov/the-world-factbook/
Mateas, M., & Jhala, A. (2011). Modeling player retention in Madden NFL 11. Presented at Innovative Applications of Artificial Intelligence. http://users.soe.ucsc.edu/~bweber/pubs/madden11retention.pdf
Wikipedia. (2015). One-child policy. http://en.wikipedia.org